At one time, I had to work a lot with logs. They could be large and on different servers. It was required not to find something specific, but to understand why the system behaves not as it should. For some reason, there was no log aggregator.
I wanted to have a log viewer that allows, at any time, to open any file without downloading it to the local machine, like the less command in the linux console. But at the same time, there should be convenient text highlighting, as in the IDE, and filtering records by various parameters. Filtering and searching should work by events in the log, and not by lines, like grep, this is important when there are multi-line entries, for example, errors with stack traces. It should also be possible to view records from several files at once on one page, freezing them according to the timestamp, even if the files are located on different nodes.
And I figured out how to make such a utility!
Log Viewer is a small web application that runs on the nodes where the logs are located, and displays these logs through the Web interface. This is a viewer, not an aggregator, there is no indexing or reading of the entire log into memory, only the part of the log that the user is currently viewing is read. This approach allows you to almost not take up resources.
I foresee performance questions like “Is it possible to quickly filter records without indexing? In bad cases, you will have to stop scanning the entire log to find at least one entry that matches the filter. " Firstly, log scanning works pretty fast, 1GB is read for about 3.5 seconds, this is tolerable. Secondly, the time interval in which we are looking for a problem is usually known, if a filter by date is specified, then only that part of the file will be scanned, which contains records related to that time. You can find the boundary of a time interval in a file very quickly with a binary search.
Log display
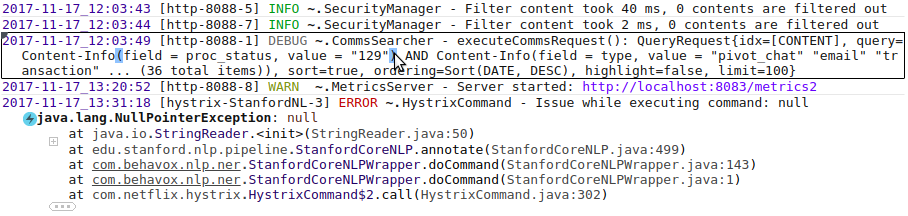
To make it easier to distinguish the boundaries of one record, the record under the cursor is highlighted with a rectangle; the severity field is highlighted in different colors depending on the value, paired brackets are highlighted when you hover over one of them.
Pay attention to the stack trace of the execution, only the most interesting lines are shown, the rest are under "+" and "...", interesting lines are classes from packages belonging to the main application, adjacent to them, and the first line. The main application packages are specified in the configuration. In this form, the stack trace takes up much less screen space and is more convenient to watch. Perhaps this idea will appeal to Java IDE developers.
The logger name is also abbreviated: "~ .SecurityManager". Only the class name is shown and the package is collapsed into "~".
Folding affects only the display, the search works on the original text. If a match is found in the abbreviated part of the text, then this part of the text will automatically appear. Also, if the user selects the text and presses Ctrl + C, the original text will be copied to the clipboard, without any abbreviations.
The architecture makes it easy to hang highlighting or tooltips on the text, thanks to this, various nice little things have been done, such as displaying the date in human format, if it is printed as a number:

Filtration
The set of filters depends on the format of the log. Some filters are always available, for example, a substring filter, and some appear if a field of a certain type is present in the log. This allows you to create custom filters for certain types of fields. For example, if there is a severity field in the log, then the following UI component will appear in the top panel:
Severity filter
It is very convenient to add filters from the context menu. You can select the text, right-click and select "Don't show records with this text." A text filter will be automatically added to the filter panel, hiding records with such text. It helps when the log is littered with monotonous entries that are not interesting at the moment.
Adding filters from the context menu

You can click on a record and select "Hide subsequent records" or "Hide previous records" to work only with a certain part of the log. Hiding is done by adding a filter by date.
For complex cases, you can set a filter with a condition written in JavaScript. Such a filter is a function that takes one record and returns true or false.
JavaScript filter example
When changing filters, the viewer tries to preserve the position in the log as much as possible. If there is a selected record, then changing the filters will not change its position on the screen, and the records around it will disappear or appear. The user can set a filter so that only errors are visible, find a suspicious error, then remove the filter and see what happened around this error.
The filter bar status is displayed in the URL parameters so that the current configuration can be bookmarked in the browser.
Small but useful features
When you find something interesting - you want to share it with the team, for this you can create a special link to the current position in the log, and anyone who opens it will see exactly the same page that was when the link was created, including the state of filters, text in the search field , selected entry, etc.
If the server is located in a different time zone, a tooltip with the date in the user's time zone will appear above the date text.
Configuration
I've tried to keep the configuration as simple as possible so that everything works out of the box. If you ask the user to set the log format, then most will simply close the application and go to watch the old fashioned way. Therefore, the log format is recognized automatically. Of course, this does not always work and is often not accurate. For such cases, you can set the log format manually in the configuration file. You can use patterns log4j, logback or just regexp. If your log was not recognized, but it seems to you that it should - create an issue on GitHub, this will help the project.
The most useful setting is the list of visible files. By default, all files with the ".log" extension are available and the entire directory structure is visible, but this is not very good from a security standpoint. In the configuration file, you can limit the visibility of files using a list of patterns like this:
The user will only have access to .log files in the / opt / my-app / logs directory and any files in the ~ / work directory and its subdirectories.
More details in the documentation on GitHub.
Working with multiple nodes
Merging files located on different nodes is a killer feature for which the project was started. As I said, the file is never fully downloaded from one node to another and is not indexed. Therefore, Log Viewer must be running on each of the nodes. The user opens the web UI on one of the nodes, specifies the location of the logs, and the Log Viewer connects to other LogViewer instances to load the contents of the log through them. Records from all open files are merged according to the timestamp and shown as if it were one file.
I will briefly describe how it works under the hood. When the user opens the page, it is necessary to show the end of the log, for this a request is sent to each node "give the last N records", where N is the number of lines that fit on the screen. The received records are sorted by timestamp, the last N records are taken and shown to the user. When the user scrolls up the page, a request is sent to all nodes "give the last N records with a timestamp less than T", where T is the timestamp of the topmost record on the screen. The resulting records are sorted and added to the page. When scrolling down, the same thing happens, only in the other direction. Searching for a position in a file where records older / younger than T are located works very quickly, since the records are sorted by timestamp and binary search can be used. There are many nuances, but the general scheme is as follows.
At the moment, there is no UI for selecting files on different nodes, you have to register files in the URL parameters in the following form:
http: // localhost: 8111 / log? path = /opt/my-app/logs/a.log@hostname1& path = /opt/my-app/logs/b.log@hostname1& path = /opt/my-app/logs/c.log@hostname2
everyone here the "path" parameter specifies one file, after the "@" the host is indicated where the file is located and the log viewer instance is launched. Multiple hosts can be specified, separated by commas. If "@" is missing, the file is on the current node. In order not to deal with huge URLs, it is possible to set short links in the configuration, in the section log-paths = { … }.
Embedding the viewer in your application
Log Viewer can be connected to your Java Web application as a library so that it can show its logs to the user. Sometimes it is more convenient than launching it as a separate application. It is enough just to add a dependency to the library library via Maven / Gradle and connect one configuration class to the spring context. Everything else will be configured automatically, the log viewer will itself recognize which logging system is used and will take the location and format of the logs from its configuration. By default, the UI is mapped to / logs, but everything can be customized. So far, auto-configuration only works with Log4j and Logback.
This has been tested on a small number of applications, if you have any problems - feel free to post to the discussions on GitHub.
What is planned to be done in the future
It would be convenient if there was an opportunity to leave comments on entries. For example, attach a ticket number to an error message. The comment should be visible to all users, and when the same error flies the next time, it will be clear what to do with it.
There are many ideas for small UI improvements. For example, if a piece of JSON is found in the text, then you want the viewer to be able to display it in formatted form, and not in one line. I would like to be able to set a severity filter for a separate class, and not all at once.
Sometimes there is no way to open a port on the server to view the logs, there is only SSH access. You can make support for work via SSH. The Web UI will go up on the local machine, connect via SSH to the server and launch a special agent there. The agent will accept commands via the input stream and return the required parts of the log via the output stream.
I'd love to hear your feedback.
Project on GitHub: https://github.com/sevdokimov/log-viewer
I wanted to have a log viewer that allows, at any time, to open any file without downloading it to the local machine, like the less command in the linux console. But at the same time, there should be convenient text highlighting, as in the IDE, and filtering records by various parameters. Filtering and searching should work by events in the log, and not by lines, like grep, this is important when there are multi-line entries, for example, errors with stack traces. It should also be possible to view records from several files at once on one page, freezing them according to the timestamp, even if the files are located on different nodes.
And I figured out how to make such a utility!
Log Viewer is a small web application that runs on the nodes where the logs are located, and displays these logs through the Web interface. This is a viewer, not an aggregator, there is no indexing or reading of the entire log into memory, only the part of the log that the user is currently viewing is read. This approach allows you to almost not take up resources.
I foresee performance questions like “Is it possible to quickly filter records without indexing? In bad cases, you will have to stop scanning the entire log to find at least one entry that matches the filter. " Firstly, log scanning works pretty fast, 1GB is read for about 3.5 seconds, this is tolerable. Secondly, the time interval in which we are looking for a problem is usually known, if a filter by date is specified, then only that part of the file will be scanned, which contains records related to that time. You can find the boundary of a time interval in a file very quickly with a binary search.
Log display
To make it easier to distinguish the boundaries of one record, the record under the cursor is highlighted with a rectangle; the severity field is highlighted in different colors depending on the value, paired brackets are highlighted when you hover over one of them.
Pay attention to the stack trace of the execution, only the most interesting lines are shown, the rest are under "+" and "...", interesting lines are classes from packages belonging to the main application, adjacent to them, and the first line. The main application packages are specified in the configuration. In this form, the stack trace takes up much less screen space and is more convenient to watch. Perhaps this idea will appeal to Java IDE developers.
The logger name is also abbreviated: "~ .SecurityManager". Only the class name is shown and the package is collapsed into "~".
Folding affects only the display, the search works on the original text. If a match is found in the abbreviated part of the text, then this part of the text will automatically appear. Also, if the user selects the text and presses Ctrl + C, the original text will be copied to the clipboard, without any abbreviations.
The architecture makes it easy to hang highlighting or tooltips on the text, thanks to this, various nice little things have been done, such as displaying the date in human format, if it is printed as a number:
Filtration
The set of filters depends on the format of the log. Some filters are always available, for example, a substring filter, and some appear if a field of a certain type is present in the log. This allows you to create custom filters for certain types of fields. For example, if there is a severity field in the log, then the following UI component will appear in the top panel:
Severity filter
It is very convenient to add filters from the context menu. You can select the text, right-click and select "Don't show records with this text." A text filter will be automatically added to the filter panel, hiding records with such text. It helps when the log is littered with monotonous entries that are not interesting at the moment.
Adding filters from the context menu
You can click on a record and select "Hide subsequent records" or "Hide previous records" to work only with a certain part of the log. Hiding is done by adding a filter by date.
For complex cases, you can set a filter with a condition written in JavaScript. Such a filter is a function that takes one record and returns true or false.
JavaScript filter example
Code:
function isVisibleEvent(text, fields) {
var match = text.match(/Task completed, elapsed time: (\d+)ms$/)
if (!match)
return false // Don't show events not matched the pattern

var time = parseInt(match[1])

return time > 500 // Show only events where elapsed time is more than a threshold
}
When changing filters, the viewer tries to preserve the position in the log as much as possible. If there is a selected record, then changing the filters will not change its position on the screen, and the records around it will disappear or appear. The user can set a filter so that only errors are visible, find a suspicious error, then remove the filter and see what happened around this error.
The filter bar status is displayed in the URL parameters so that the current configuration can be bookmarked in the browser.
Small but useful features
When you find something interesting - you want to share it with the team, for this you can create a special link to the current position in the log, and anyone who opens it will see exactly the same page that was when the link was created, including the state of filters, text in the search field , selected entry, etc.
If the server is located in a different time zone, a tooltip with the date in the user's time zone will appear above the date text.
Configuration
I've tried to keep the configuration as simple as possible so that everything works out of the box. If you ask the user to set the log format, then most will simply close the application and go to watch the old fashioned way. Therefore, the log format is recognized automatically. Of course, this does not always work and is often not accurate. For such cases, you can set the log format manually in the configuration file. You can use patterns log4j, logback or just regexp. If your log was not recognized, but it seems to you that it should - create an issue on GitHub, this will help the project.
The most useful setting is the list of visible files. By default, all files with the ".log" extension are available and the entire directory structure is visible, but this is not very good from a security standpoint. In the configuration file, you can limit the visibility of files using a list of patterns like this:
Code:
logs = [
{
path: "/opt/my-app/logs/*.log"
},
{
path: ${HOME}"/work/**"
}
]
The user will only have access to .log files in the / opt / my-app / logs directory and any files in the ~ / work directory and its subdirectories.
More details in the documentation on GitHub.
Working with multiple nodes
Merging files located on different nodes is a killer feature for which the project was started. As I said, the file is never fully downloaded from one node to another and is not indexed. Therefore, Log Viewer must be running on each of the nodes. The user opens the web UI on one of the nodes, specifies the location of the logs, and the Log Viewer connects to other LogViewer instances to load the contents of the log through them. Records from all open files are merged according to the timestamp and shown as if it were one file.
I will briefly describe how it works under the hood. When the user opens the page, it is necessary to show the end of the log, for this a request is sent to each node "give the last N records", where N is the number of lines that fit on the screen. The received records are sorted by timestamp, the last N records are taken and shown to the user. When the user scrolls up the page, a request is sent to all nodes "give the last N records with a timestamp less than T", where T is the timestamp of the topmost record on the screen. The resulting records are sorted and added to the page. When scrolling down, the same thing happens, only in the other direction. Searching for a position in a file where records older / younger than T are located works very quickly, since the records are sorted by timestamp and binary search can be used. There are many nuances, but the general scheme is as follows.
At the moment, there is no UI for selecting files on different nodes, you have to register files in the URL parameters in the following form:
http: // localhost: 8111 / log? path = /opt/my-app/logs/a.log@hostname1& path = /opt/my-app/logs/b.log@hostname1& path = /opt/my-app/logs/c.log@hostname2
everyone here the "path" parameter specifies one file, after the "@" the host is indicated where the file is located and the log viewer instance is launched. Multiple hosts can be specified, separated by commas. If "@" is missing, the file is on the current node. In order not to deal with huge URLs, it is possible to set short links in the configuration, in the section log-paths = { … }.
Embedding the viewer in your application
Log Viewer can be connected to your Java Web application as a library so that it can show its logs to the user. Sometimes it is more convenient than launching it as a separate application. It is enough just to add a dependency to the library library via Maven / Gradle and connect one configuration class to the spring context. Everything else will be configured automatically, the log viewer will itself recognize which logging system is used and will take the location and format of the logs from its configuration. By default, the UI is mapped to / logs, but everything can be customized. So far, auto-configuration only works with Log4j and Logback.
This has been tested on a small number of applications, if you have any problems - feel free to post to the discussions on GitHub.
What is planned to be done in the future
It would be convenient if there was an opportunity to leave comments on entries. For example, attach a ticket number to an error message. The comment should be visible to all users, and when the same error flies the next time, it will be clear what to do with it.
There are many ideas for small UI improvements. For example, if a piece of JSON is found in the text, then you want the viewer to be able to display it in formatted form, and not in one line. I would like to be able to set a severity filter for a separate class, and not all at once.
Sometimes there is no way to open a port on the server to view the logs, there is only SSH access. You can make support for work via SSH. The Web UI will go up on the local machine, connect via SSH to the server and launch a special agent there. The agent will accept commands via the input stream and return the required parts of the log via the output stream.
I'd love to hear your feedback.
Project on GitHub: https://github.com/sevdokimov/log-viewer