
This is the fourth and final article in a series on x64dbg. In this article, we will use this knowledge to demonstrate some of the techniques that can be used to reverse engineer malware.
Examples of using x64dbg
Reverse engineering malware using a tool like x64dbg is ideal if you want to understand and study the specific features of a sample malware. During a cybersecurity incident, a company's response plan may require malware analysis to identify some key IOCs.This can be done by running malware in a virtual machine and using several malware analysis tools. Certain key indicators such as C2 IP addresses can be identified quickly while malware copies itself to disk to hide.
x64dbg is not used for this initial malware screening - instead, it helps in deep insight into how malware acts and behaves on a compromised device. Running a malware on a virtual machine might show that it is creating a seemingly random name for itself, after which x64dbg can be used to determine how such filenames are generated for malware using x64dbg
Step-by-step malware analysis with x64dbg
We will use the sample we analyzed in the previous article.Before uploading malware to x64dbg, we need to make some changes to the address of the malware in our virtual machine. When analyzing malware in x64dbg, we rename the binary and copy it to the location that the malware created as part of our behavioral analysis. Replicating this behavior provides additional assurance that we will see the true behavior of the malware in the debugger.
When analyzing this sample, the malware was found to perform some checks to avoid analysis with tools such as x64dbg - this is done by checking for the presence of a command line argument, which can be determined by detonating the malware and monitoring activity with ProcMon.

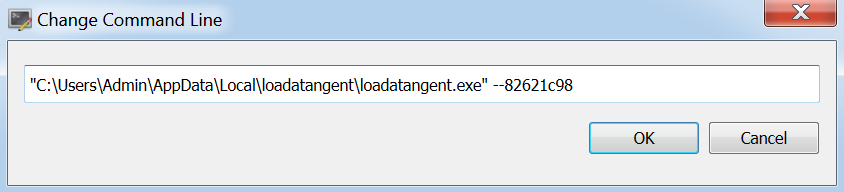
In the image above, we can see that the malware renamed itself to loadatangent.exe and copied itself to the following location:
'C: \ Users \ Admin \ AppData \ Local \ loadatangent \ loadatangent.exe'
She also added the –82621c98 argument to the process.
To reproduce the behavior of the malware, we first rename the unpacked malware to loadatangent.exe and move it to that location on the disk. You can now start uploading the file to x64dbg by dragging and dropping the file onto the x64dbg icon on your desktop.
After loading x64dbg, add an additional argument to the command line. To do this, select "File" and then - "Change command line".

Here you can add an argument that was identified by ProcMon.
When analyzing the unpacked sample, we first check the malware import address table (IAT). This allows you to test any imported functions that you can focus on in x64dbg.
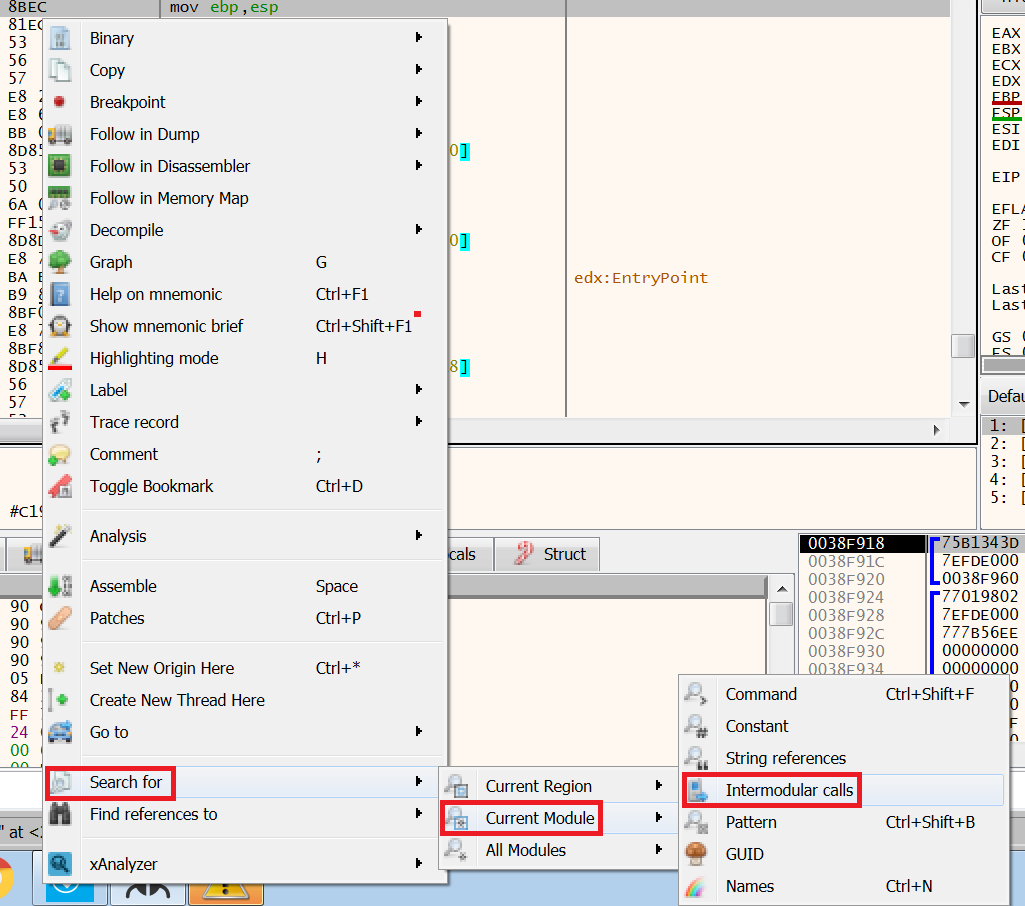
To do this, right-click on the assembly code and select Search, Current Module, and then Intermodule Calls.
However, initially there is only one entry for IsProcessorFeaturePresent:

This is because the Windows API names that will be imported by the malware are hashed. Malware developers use this IAT obfuscation to make it harder to parse a binary file.

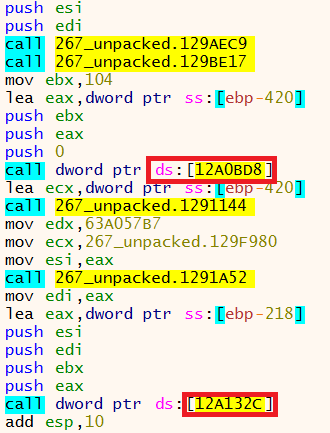
In the image above, when you hover the mouse over the first function, a pop-up preview of that function appears. From the previous article, we can conclude that hashed values are moved to a large number of variables containing ebp- *.
Because of the large number of declared variables and the amount of stack space allocated on the stack by the "sub esp, 630" instruction, it is likely that these values are obfuscated Windows API names.
By skipping these two functions, we can see that some of the function names have changed to valid Windows API names.
Function names in x64dbg before deobfuscation:
Function names in x64dbg after deobfuscation:

When searching for module-to-module calls, the imported address table is now displayed.

We can now identify the functions of interest and start setting breakpoints in the API, which can give us more information about what the malware is doing.
Setting breakpoints
Now, after filling out the IAT, we want to start examining the functions imported by the malware to see if they are being used, and if so, investigate what they do. The IAT of some of the imported functions is pretty self-explanatory due to the naming conventions used, such as CreateDirectoryW. However, to find out where this function is used in x64dbg, we need to run the malware and set a breakpoint in the API to stop it before executing the function.There are several different ways to set breakpoints. In the list generated earlier, you can right-click on the function you want to analyze and select Toggle Breakpoint. In the image below, you can see that the breakpoint is set to CreateMutexW.
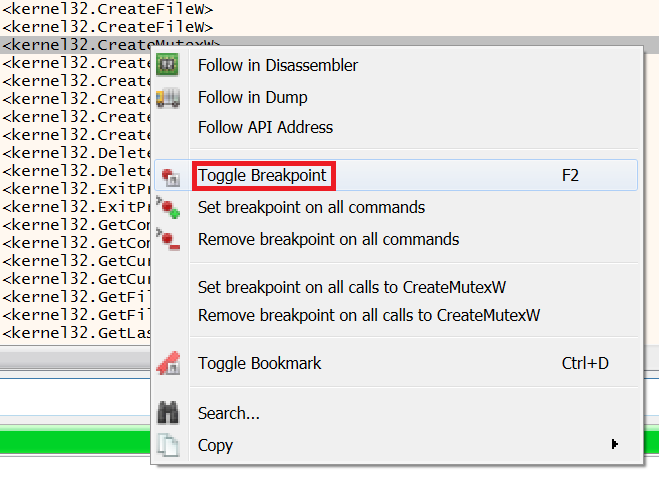
Then the address of this function turns red, indicating that the point is now set.

Breakpoints can also be set from the command line at the bottom line of x64dbg. This is done by entering the syntax "bp" followed by the name of the Windows API on which you want to set the breakpoint. Please note that API names are case sensitive.

Press Enter to set a breakpoint.

An updated message appears to confirm that the breakpoint has been set.
Another way to set a breakpoint is to use the keyboard shortcut CTRL + G and retype the Windows API name. If x64dbg detects an API in a malicious program, it will display a "Valid Expression" message:

Clicking OK again will open a message at the bottom of the x64dbg confirming that the breakpoint has been set. Selecting the Breakpoints tab will confirm the set breakpoints:
When you hit a breakpoint, you might end up in the DLL that contains this API. To navigate to the malware developers' code, select Debug, then Run to Return or Run to User Code.

Analysis of imported functions
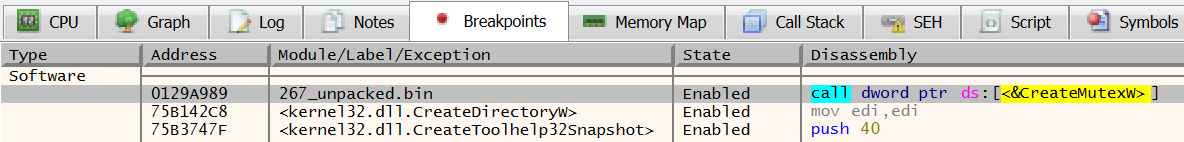
When you analyze multiple malware samples, you begin to recognize the features of interest that the malware uses. The CreateMutexW function is used to create a so called "mutant" or "mutex". Mutexes are often used by malware to indicate that a machine has been infected. If a machine is reinfected, the malware can run a check for the presence of a mutex, and if a mutex associated with this malware family is found, it will not try to re-infect the device.Clicking the Run button in x64dbg now runs the malware before it reaches one of our breakpoints and pauses the malware. The first breakpoint is for CreateMutexW.

The black rectangle to the left of the red address corresponds to the address of the breakpoint in the call to CreateMutexW. In the image above, we can see that there are three push statements before making this call - these are the data that will be added to the stack and will be used by the function. Using the x64dbg "xAnalyzer" plugin, we can see what these values are related to.
The Microsoft documentation is very helpful as it describes what a function does, the parameters it uses, and the data returned when the function runs successfully.
By examining the documentation for CreateMutexW, we can determine the parameter of interest.
Below is a screenshot of information about the lpname parameter used by CreateMutexW.
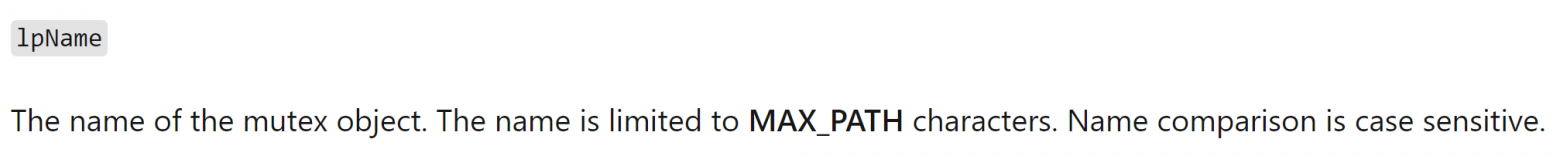
From this URL, we can infer that the lpname field that was pushed onto the stack is the name used by malware to create the Global \\ MEAA53FEC mutex. Let's take a closer look at this mutex in x64dbg to see how it generates this seemingly random name.
Scrolling up the assembly code, we can see that GetWindowsDirectoryW and GetVolumeInformationW were called before the call to CreateMutexW.

GetWindowsDirectoryW locates the Windows directory on the compromised device. We can figure out what GetVolumeInformation is responsible for by searching Google for the API name.
Based on this information, the malware extracts the volume name of the root directory - this indicates how the malware is potentially generating a name for the mutex.
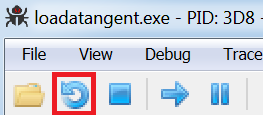
To get a closer look at what these functions do, you need to restart the malware in x64dbg, since the functions were called before CreateMutexW. To do this, click "Restart".
The previous breakpoints we set will remain, but now let's add another breakpoint for GetVolumeInformationW. Restarting the malware will lead us to the newly created breakpoint.

Looking at the parameters in x64dbg for GetVolumeInformationW, we can see that one of them refers to lpVolumeSerialNumber. Microsoft documentation confirms that the malware obtains the serial number of the device.

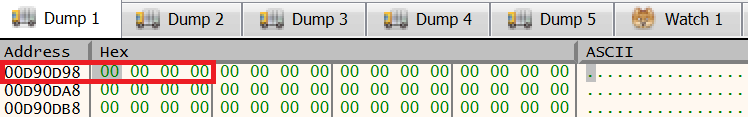
The documentation also says that this parameter stores the serial number in a variable. We can test this variable by right clicking on this parameter and choosing Follow in Dump and then selecting the address used for the variable.

After that, x64dbg presents us with the selected address, which currently contains no data:
Then jumping to the GetVolumeInformationW call performs this function and the serial number is displayed in the dump window:
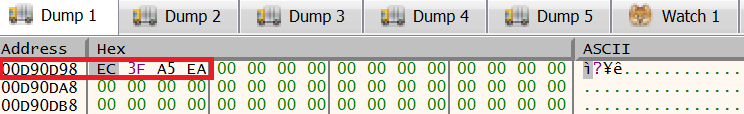
By opening the command line in the virtual machine, we can determine the serial number of the device and confirm our conclusions by entering the "vol c:" command:
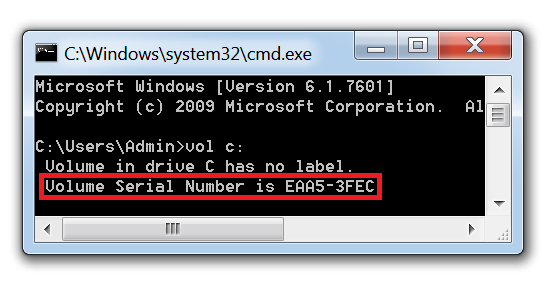
This corresponds to the information in x64dbg, however, in x64dbg the data is reversed due to the so-called byte order. By reverse engineering a portion of the malware, we have confirmed that the malware creates a unique mutex on a compromised device using a serial number.
The same technique can now be applied to explore other imported functions. Just set a breakpoint for the functions of interest and see what parameters the function uses and what data is pushed onto the stack. This will give you a ton of information that is not available in behavioral analysis of malware.