BadB
Professional
- Messages
- 2,568
- Reaction score
- 2,806
- Points
- 113
We often hear about hacks and cyberattacks. Less often - about hackers who got what they deserved for these same cyberattacks. But how often have you heard of how these hackers were tracked down and caught? I doubt it. Today we will temporarily move to the “other side of the barricades” and look at the work of fighters for justice.
Hello dear reader!
As you understand, in this article we will get acquainted with such a thing as forensics. Yes, most likely you have already heard about it, or even know what it is. But if you don’t know or have forgotten, I will remind you.
In short, forensics is called computer forensics. This is nothing more than a whole applied science of solving cyber crimes, searching for digital evidence and evidence. The topic is very interesting and deep, so in this article I will not go deep in order to avoid overloading the reader with unnecessary information.
Today we have on our agenda an extremely interesting program, which turned out to be quite a difficult task for me to get. What kind of software is so mysterious? It is called the Evidence Center.
It is the flagship product of the Russian company Belkasoft, which describes its creation as “a comprehensive digital forensics solution for removing data from devices, searching, recovering and analyzing digital evidence stored in computers and mobile devices, as well as cloud services. Evidence center facilitates the acquisition, search, analysis, storage and transmission of digital evidence located inside computers and mobile devices. The program will quickly extract digital evidence from a variety of sources by analyzing hard drives, images, cloud applications, working memory contents, iOS, Blackberry and Android backups, UFEDs, JTAGs, and chip-off dumps. ”I will translate into human language: this software is designed for computer forensics, with the help of it they scan and analyze various storage media, from a hard drive to a telephone.
At first it was a small, primitive program for performing the simplest analysis of media, but later its creators significantly expanded the development team, and their brainchild ( Evidence Center ) became much more powerful. How much? Of course, I will not conduct research and comparison of versions, but I will definitely tell you about the possibilities.
Before we start working with the software - a few words about the hardware that I use in my work and advice for novice detectives.
We will work, as you understand, with information storage devices. Specifically in this article - with hard drives. So I connect them not directly to the board, but through a separate device. Because this method is much easier, because constant visits to the computer case are not needed.
Personally, I use such a thing as the ACE AgeStar docking station (3UBT2) . It costs one and a half thousand rubles (Currently 1650). It is a fairly compact and convenient device, the data transfer rate of which reaches 5 Gb / s (500 Mb / s - USB 3.0) and is powered by a 12 volt adapter.
This miracle looks like this:
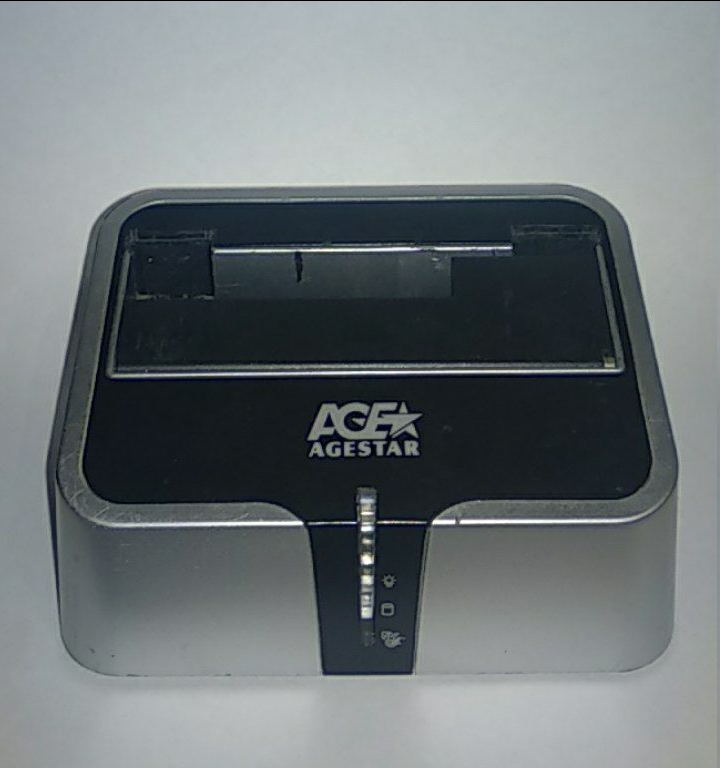 Before, without disc
On the back and with a disc:
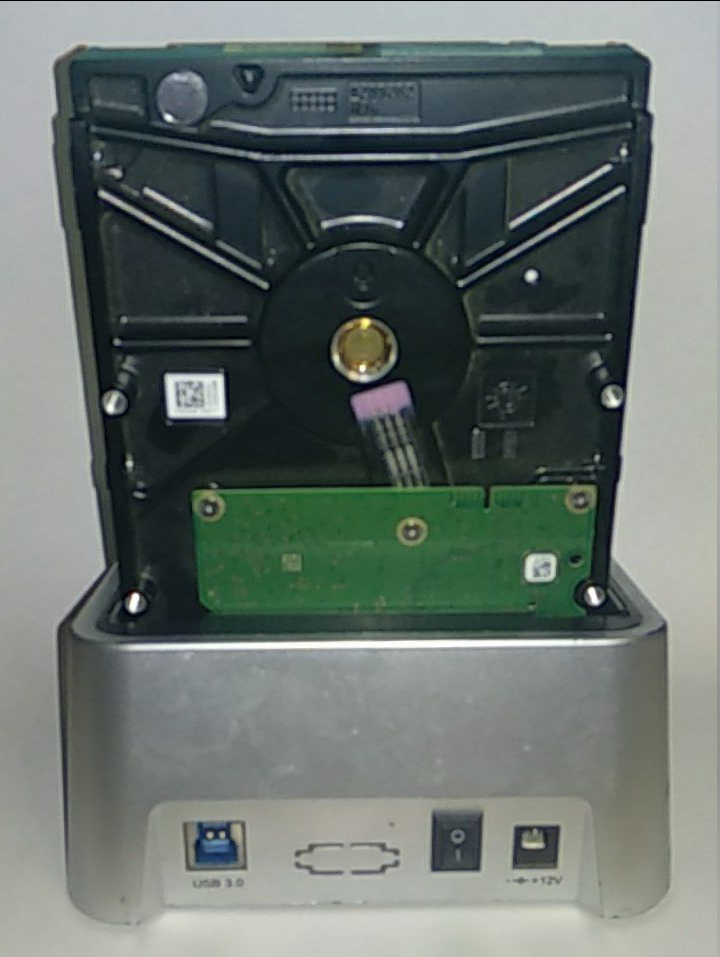 Behind. With disc
In working order
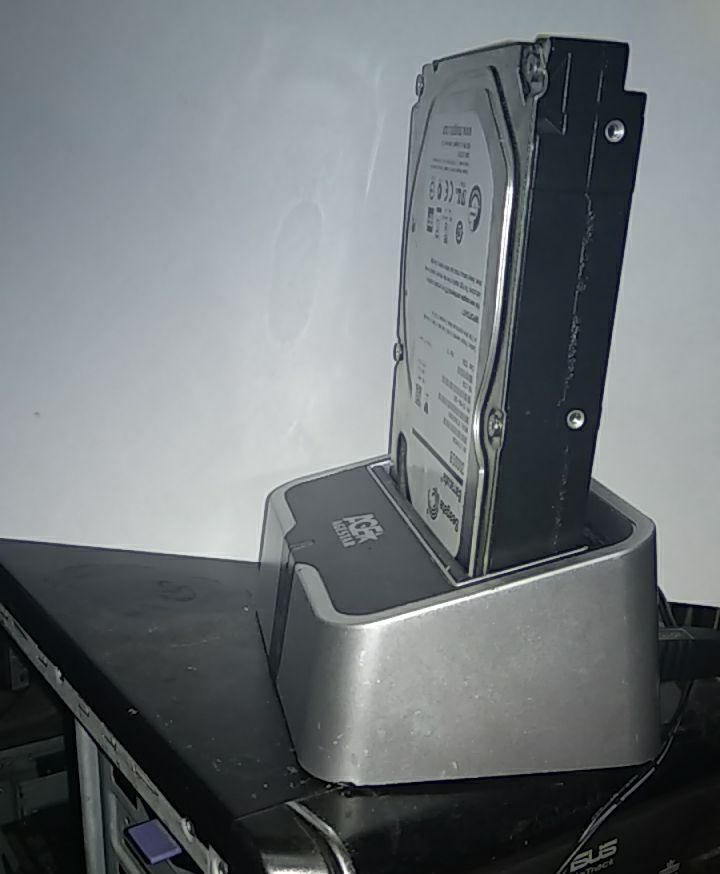 Convenient, agree
Of course, there are very small ones, you can buy them on aliexpress for only $ 3-7. But, as it seems to me, it is better to take a branded one than one made in the basement by a Chinese noun-name.
For those who do not know, a “Docking station” is a stationary device with connectors for connecting electronic devices to the main one. They (Docking Stations) are used to quickly connect multiple devices to power and data traffic cables at the same time.
In short, docking stations allow you to simultaneously charge the device and synchronize information: we power the hard drive and simultaneously read information from it.
If you don't have the money or the opportunity, don't worry. This station is needed solely for the convenience of working with media. You can easily connect a disk or other media directly (Of course, if connect \ read \ work are supported). There will be only one difference from working through the docking station - the convenience and the buzzing of the disc under the ear (in fact, not only, but this is a completely different topic that is not yet interesting to us).
From the tips for work, I can say the following:
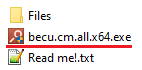
After extracting the files from the archive, the first thing we need to do is install the software itself. The installation file is named “ becu.cm.all.x64.exe “:
After starting the file, we are waiting for the installation graphical interface to appear.
The program has been translated into eleven different languages, soyou will have plenty to choose from and choose the one with which it will be most convenient for you to work. In my case, this is Russian:
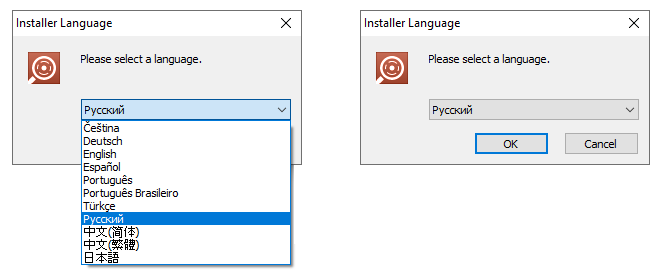
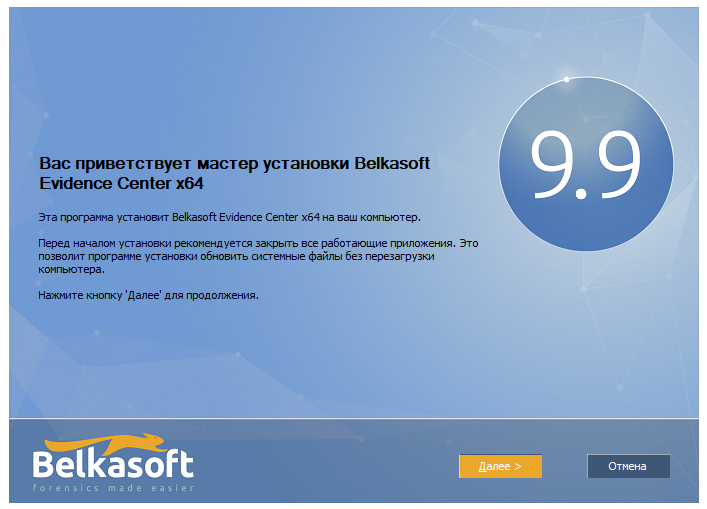
After clicking on the " OK " button, we move on to the next stage, where we are unexpectedly advised to close all running applications. In fact, this is not necessary, we do not need a reboot. At least in my case, everything happens that way. If in doubt, follow the instructions, leaving only the necessary applications for further work. Click "Next":
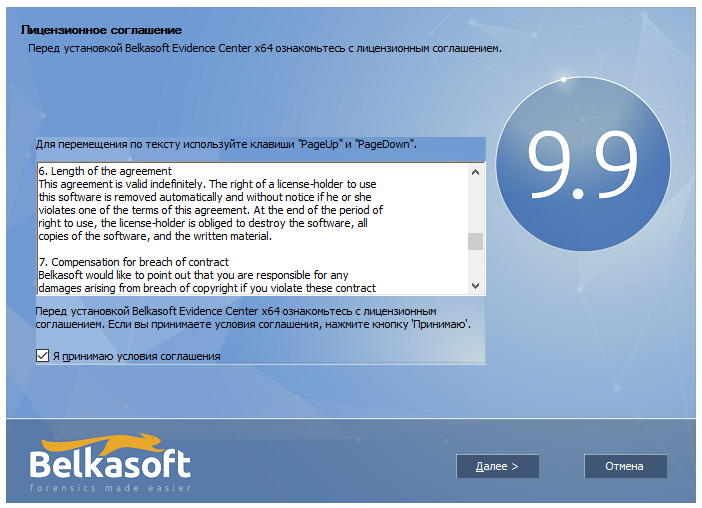
We accept the license agreement without reading it, and proceed to select the folder for installing the software. If you suddenly apunk do not want to accept any agreements, I have bad news for you (you will not be able to click on the “next” button until you confirm acceptance of the terms of the agreement (Well, or make a patch to skip this point)):
I advise you not to change the path to the folder and leave it at the default “ C: \ Program Files \ Belkasoft Evidence Center x64“:
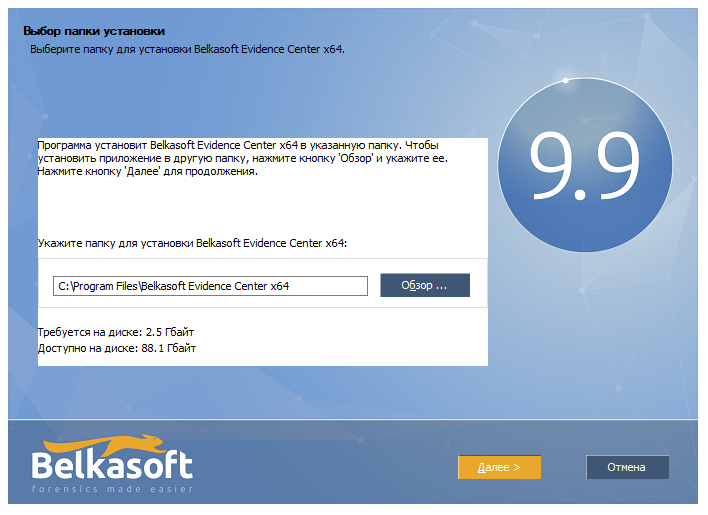 just now noticed that my disk space is running out. Not good.
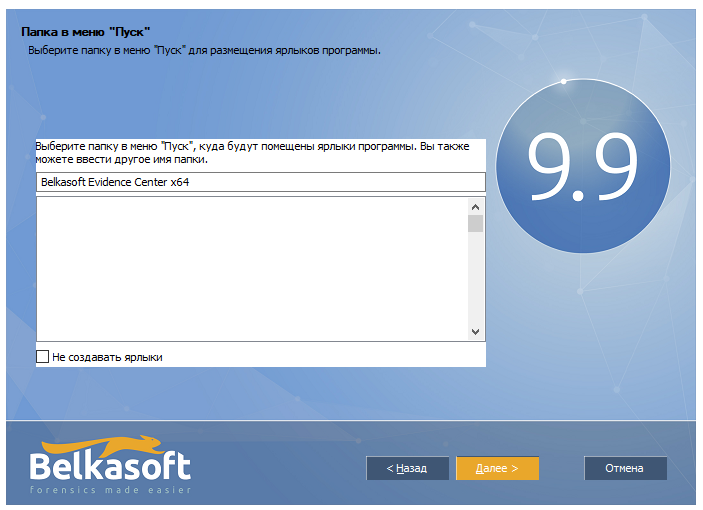
Whether or not to create a folder in the start menu is up to you:
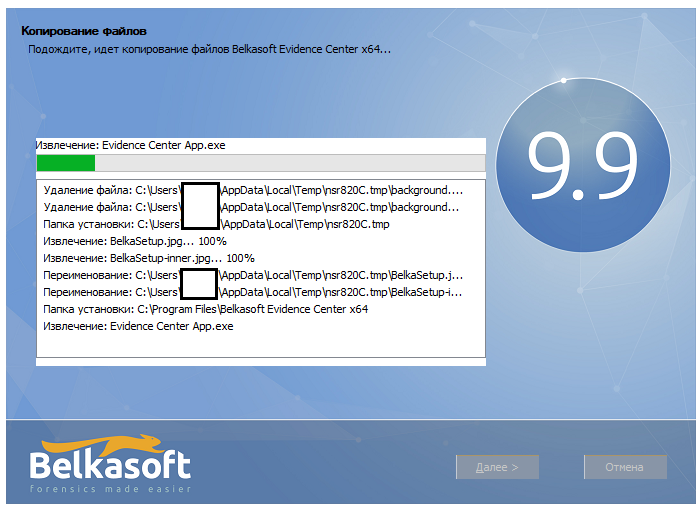
We are waiting for the program to be installed on the hard disk:
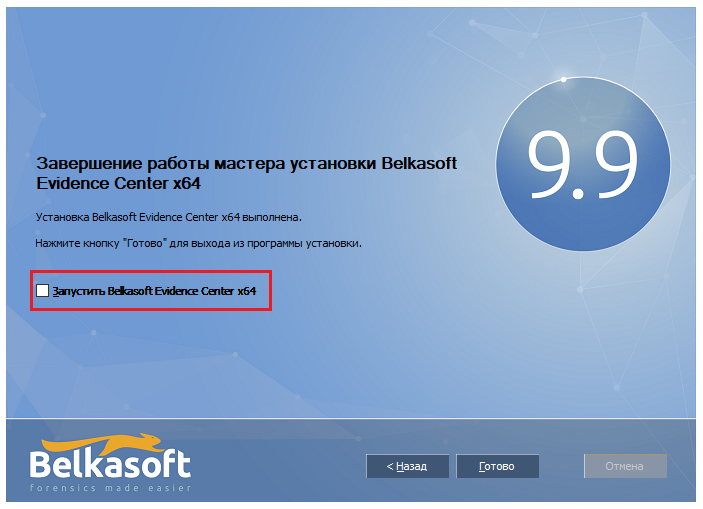
After successful installation, be sure to remove the checkbox from the program launch point. We shouldn't run this thing until we grunt:
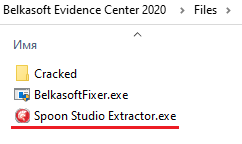
Done. We installed the software and now we are starting to crack it. To do this, go to the "Files" folder . First, we use “ Spoon Studio Extractor.exe “, which is exactly what the antivirus swears at:
Run it as administrator:
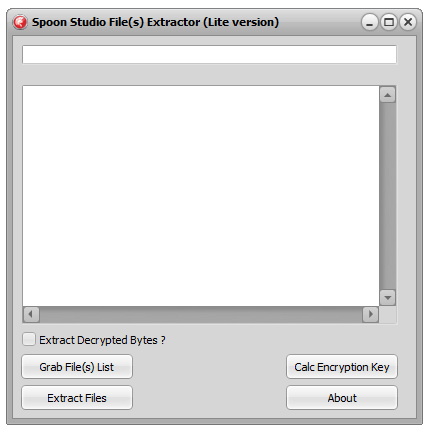
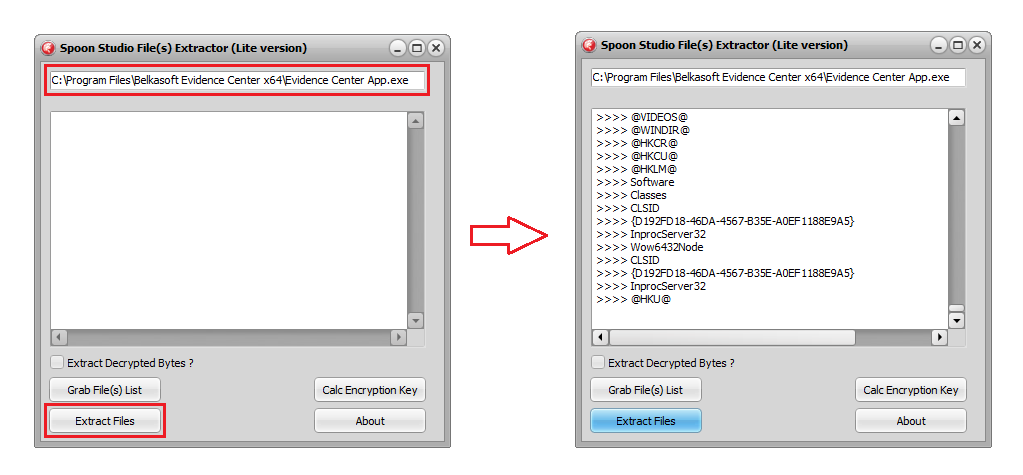
Here we need to enter the path to the Evidence Center App.exe file and extract all files by clicking on the “Extract Files” button . While extracting (or reading) files, the computer may collapse, but you should not be afraid - this is the norm. At the end of the work, the program log will contain a list of extracted files and folders:
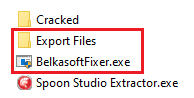
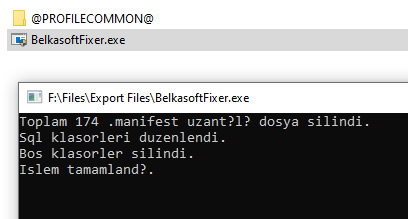
When finished, the program will create a folder named “Export Files” next to it. All extracted files will be collected there. Next We will work with this folder using the “BelkasoftFixer.exe” utility . Copy the utility to the newly created folder and run it already there
All files will be moved to the “@ PROFILECOMMON @” folder . The work will be done in a matter of seconds. Usually this is evidenced by the inscription "Islem tamamland?" (in Turkish “Process complete ”).
Who is interested in translation.
After that we move all files from the folder “@ PROFILECOMMON @” directly to the main folder of the program:
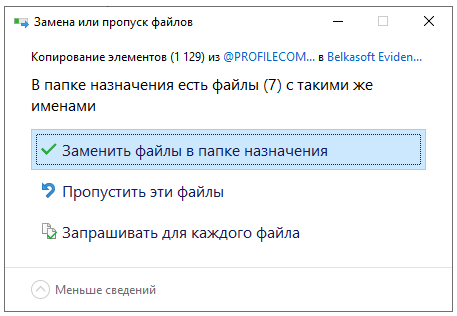
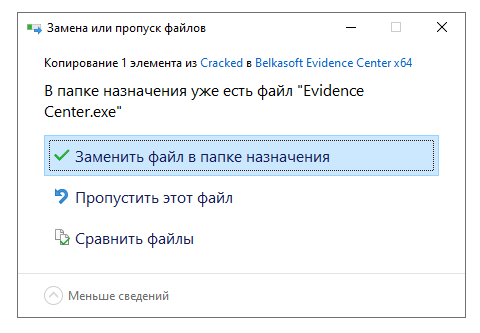
When asked about replacing files with similar names, we answer positively:
All that remains is to replace the main program files with those prepared in advance. To do this, go to the “Cracked” folder and move all its contents to the program folder with a replacement:
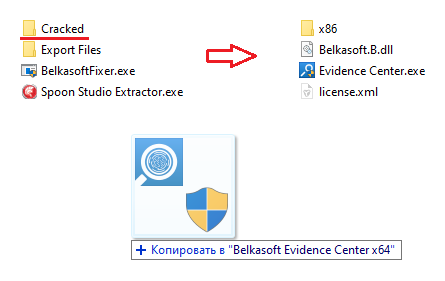
From now on, we will run the program exclusively through the file “Evidence Center.exe”
We do not touch “Evidence Center App.exe”. You can delete it altogether, but I don't delete it because I'm too lazy.
Are we launching? Let's start!
The first thing we see is a splash screen, where all its capabilities are written out.
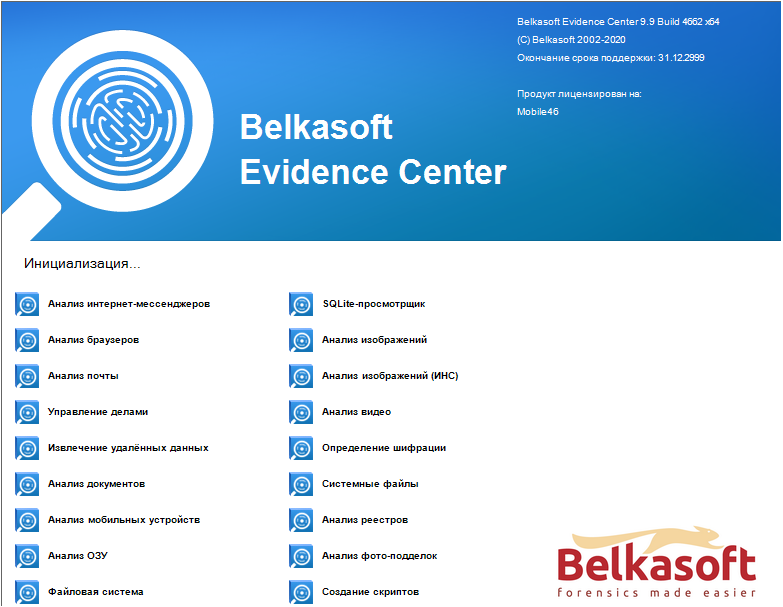 Screensaver
After the splash screen, we are greeted by the Evidence Center's main menu:
 The program itself
Before proceeding with a detailed analysis, I advise you to remember my article on Netsparker . Or rather, her meticulousness. This is, consider, a disclaimer for the main part, so that you get ready.
Well, reader, have you tensed?
Relax, we will only cover the basic functions.
So.
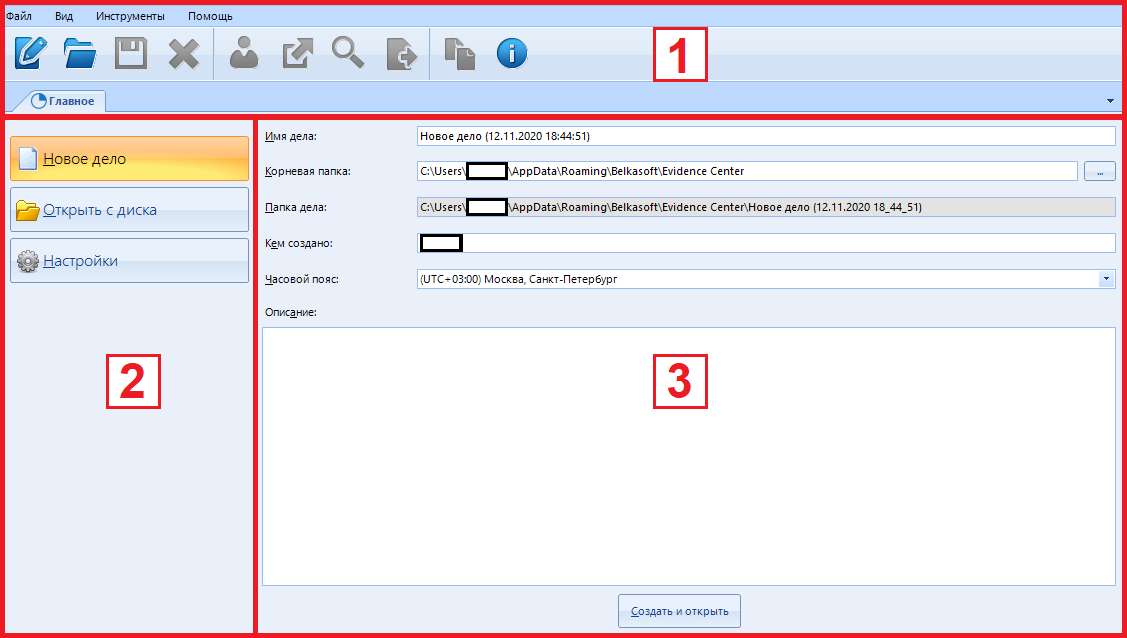
The entire program can be divided into three conditional parts:
Now a few details about each item.
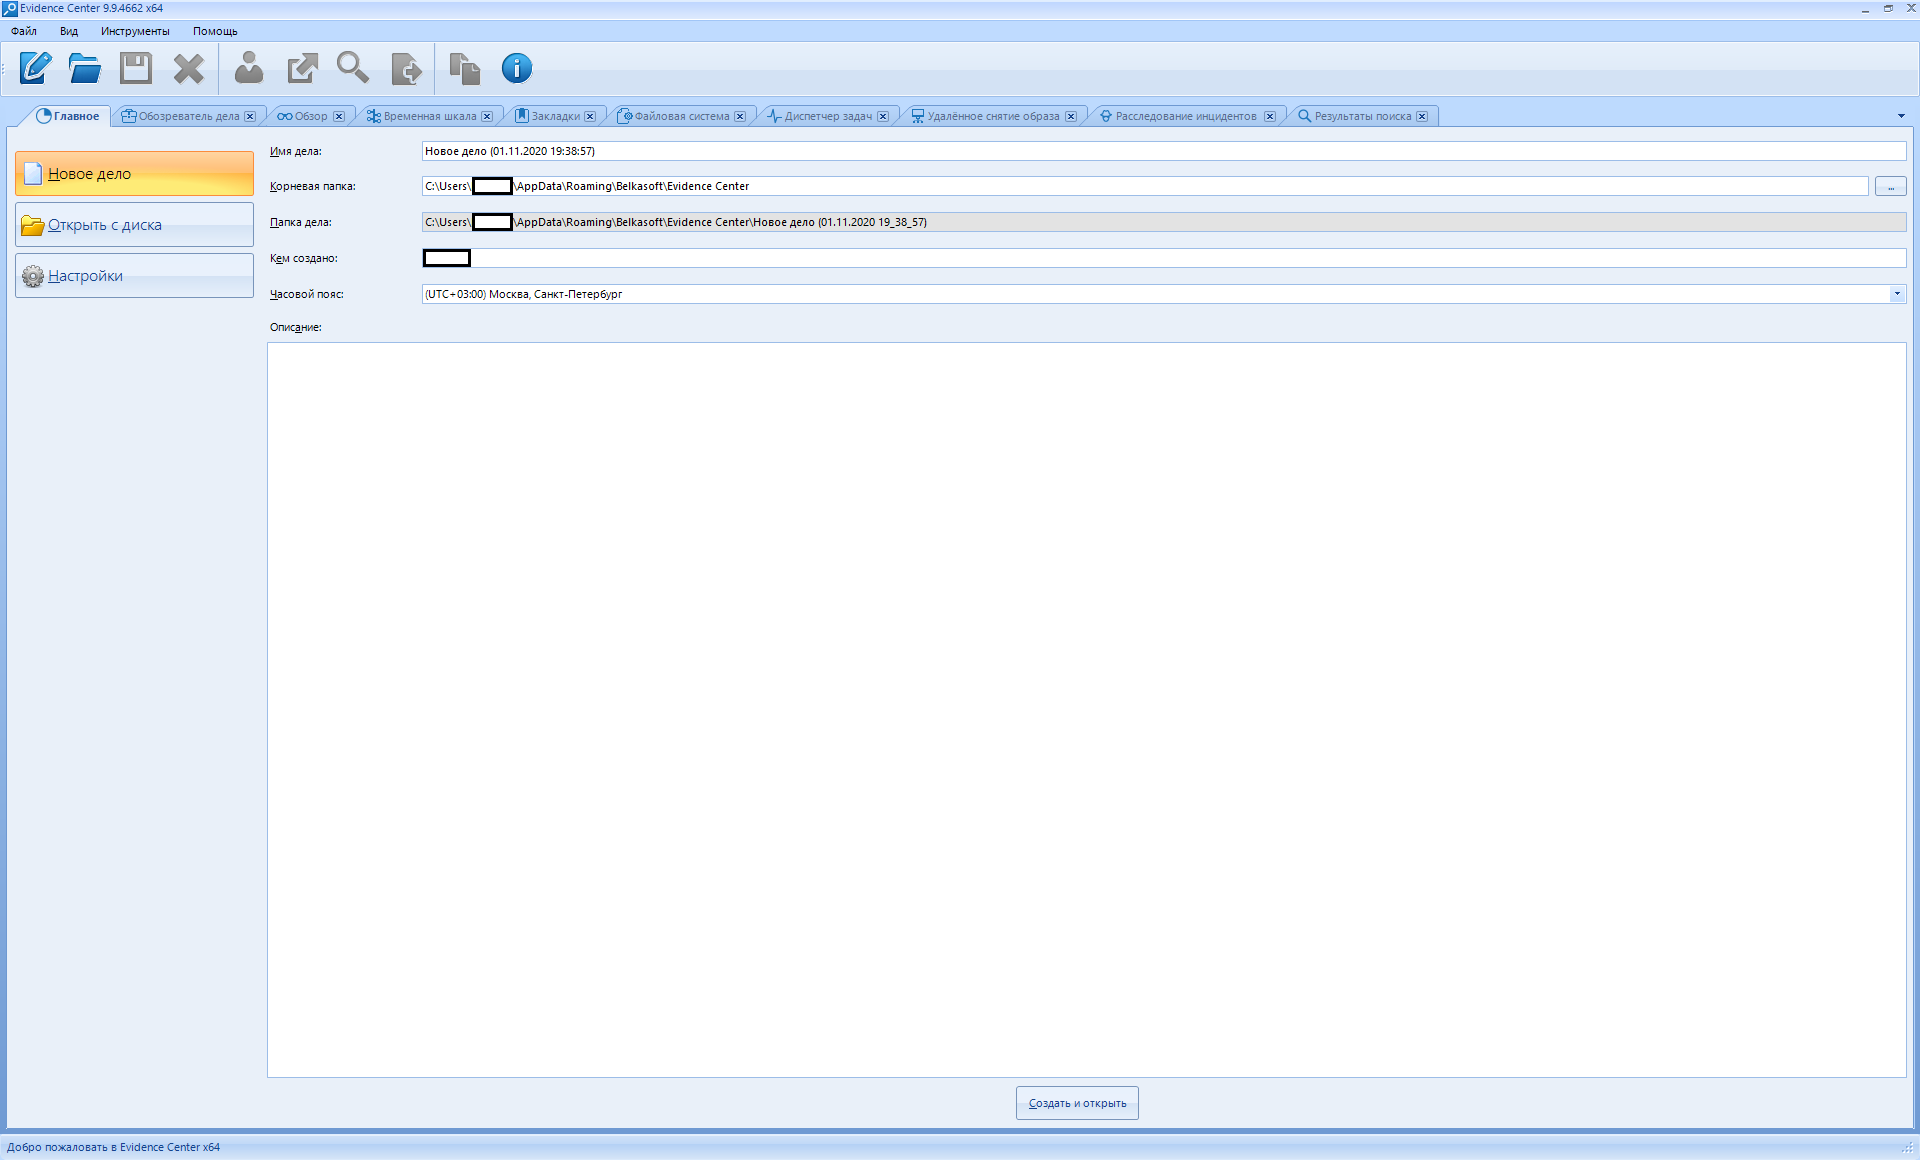
The first button is to create a new case.
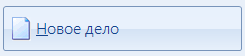
By default, when the program starts, it is already pressed.
Pay attention to what is in the right menu:
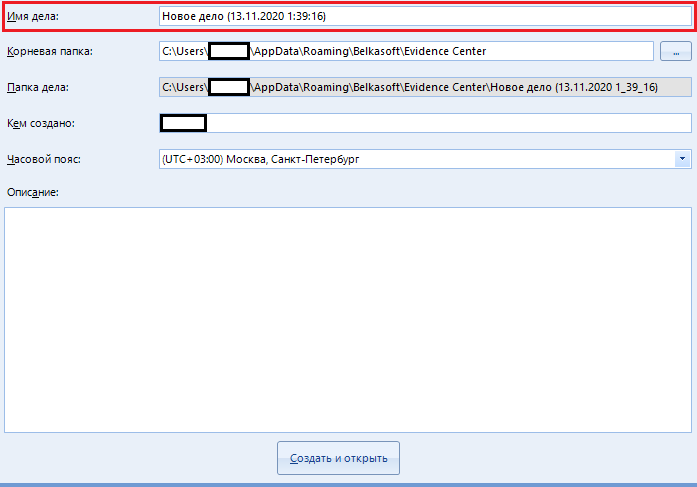
The text "case name" is set by default to the date and time of its creation. If you want, you can turn on your fantasy and write something of your own.
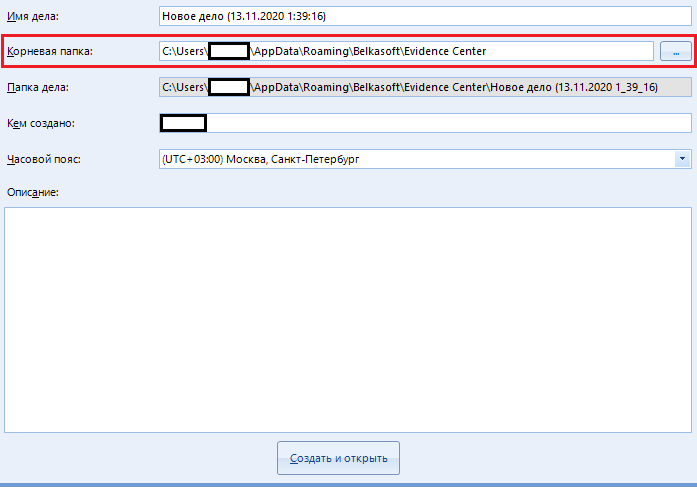
Root folder - the folder where the media scan report will be saved. You can either enter the full path to the destination folder manually, or select it in the explorer using the special button to the right of the input field:

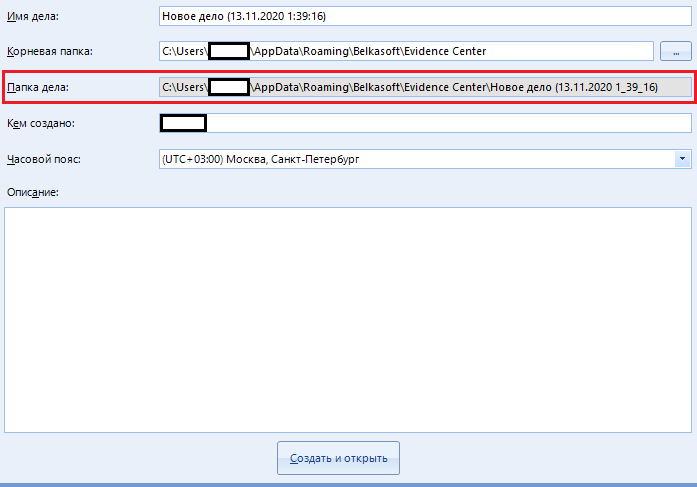
The field "Case folder" is in the inactive status "ridonli". This means that we cannot change this line. Here is the full path to our new case, which was generated from the first two points.
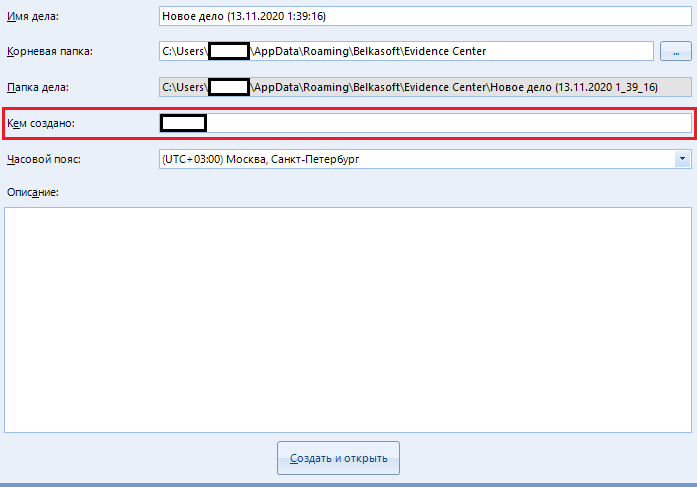
The highlighted line “Created by” indicates the name (or alias) of the person under whose supervision the scan was performed. By default, there is the name of your computer.
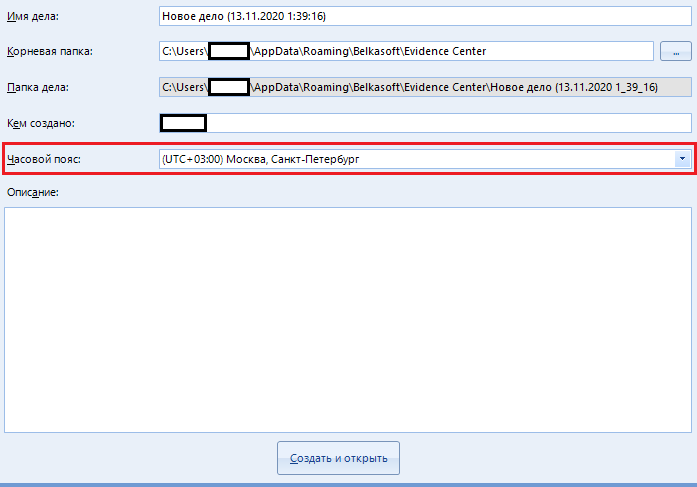
The “Time Zone” is indicated for easy reading of the scan information. I always indicate the standard belt "+03: 00", which I advise you to do too. You can ask your own if you wish.
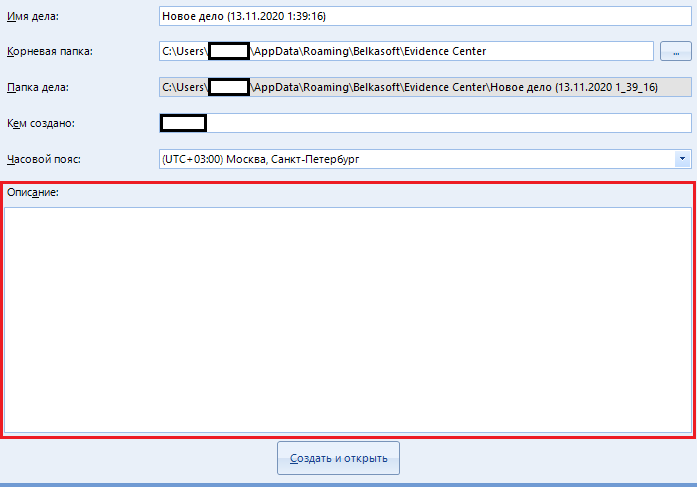
A huge text field called “Description”, unlike other items, is optional. This is just a note to the case being created. You can leave this field blank.
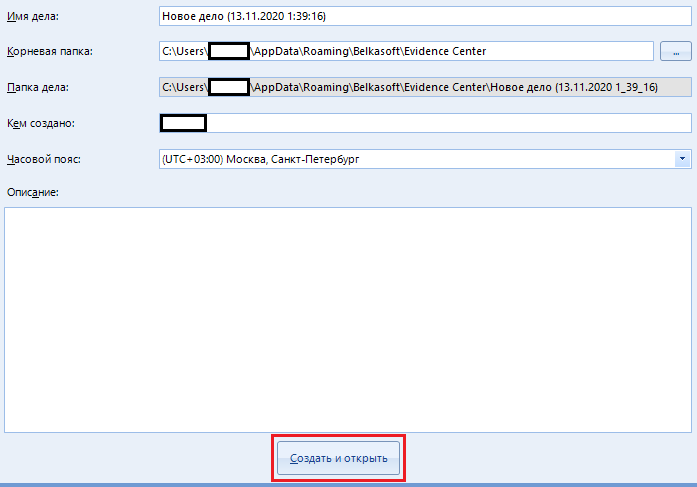
The “Create and open” button is used to create a new case and go to the choice of media for work. We'll come back to it later.
Move on to the next button on the left.
If you already have a "case" (disk scan report), then open it, obviously, by clicking the "Open from disk" button
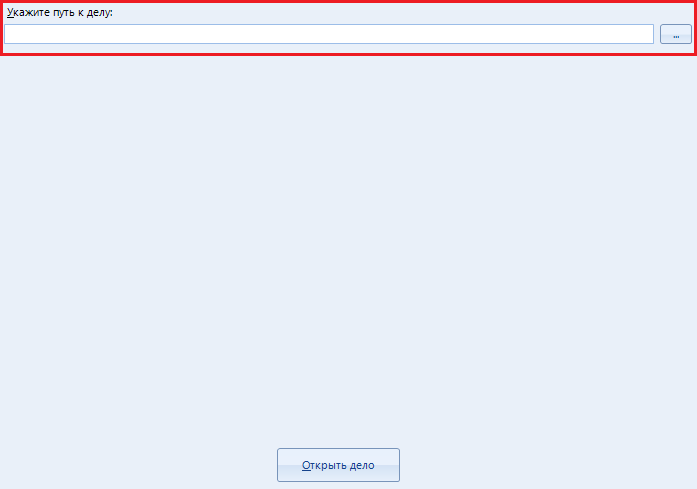
Here you can open an existing case by entering the full path to it. Otherwise, you can open it in the explorer by clicking on the button

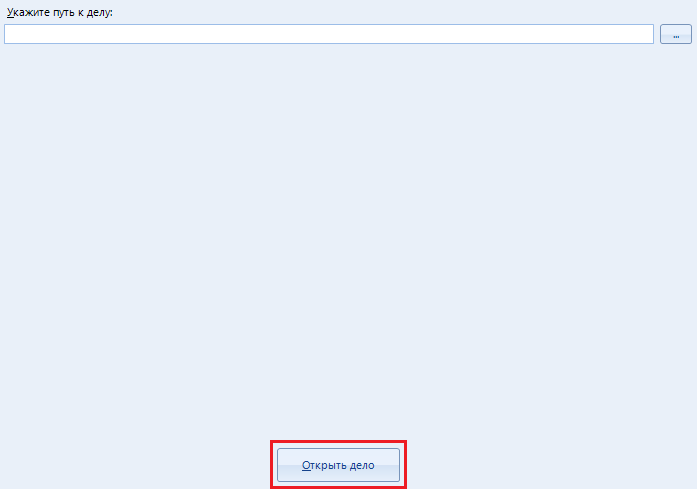
The case does not open automatically, so you have to use the "Open case" button
The last in line is “Settings”.
If something does not suit you in the operation of the program (for example, the amount of resources consumed), or you need to change one or another parameter, this item is intended for just such situations. Before starting work, I advise you to configure the program.
Perhaps this is the most interesting and basic point that I will curse while writing this article. We will not bypass it and set up the program.
After clicking on the button, a whole book of eight tabs opens:
We will study all of them (tabs) thoroughly.
Got netsparker flashbacks? Great, let's continue.
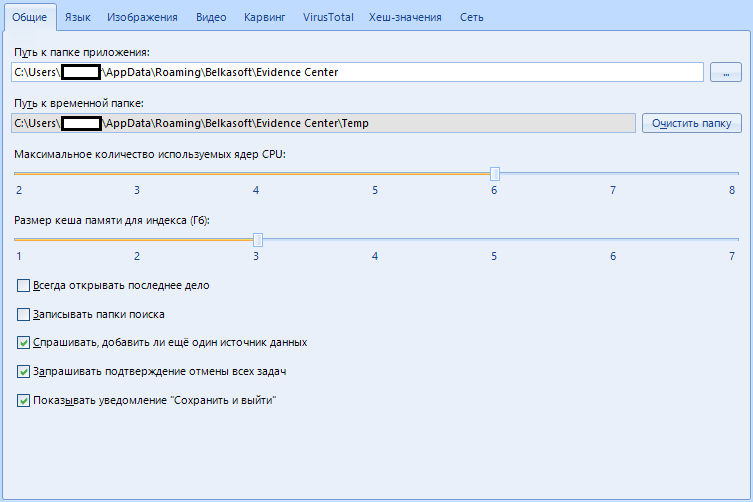
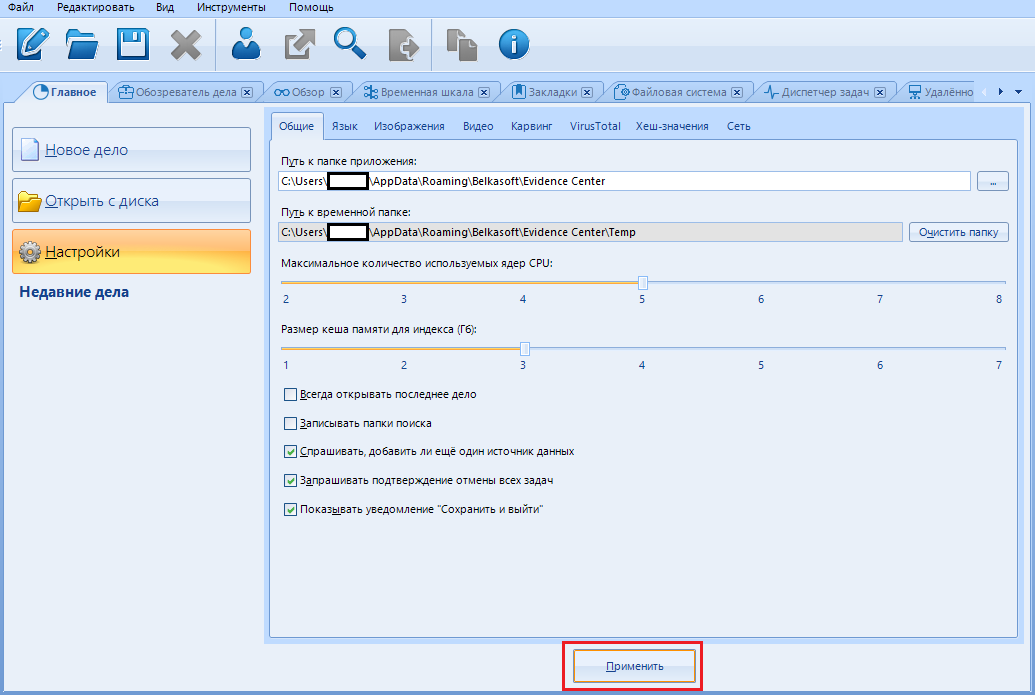
The first tab is “general”.
These are general program settings.
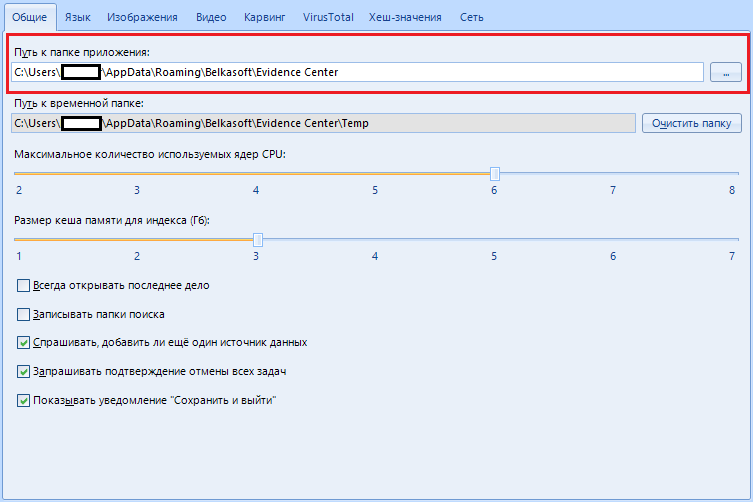
The item “Path to the application folder” is used by the program to store its parameters. In most cases, you can just leave this option as default, but if you are going to store settings and options on a flash drive, moving from one machine to another, this function will help you out.
In short, we leave it as it is, because we will not run anywhere.
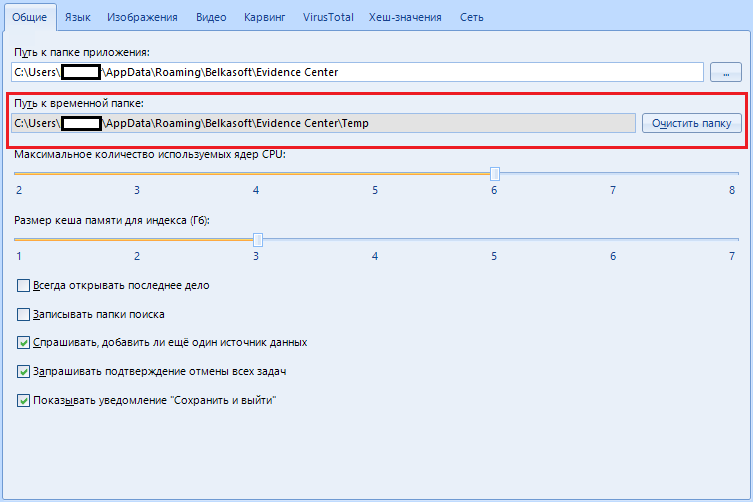
The next item "Path to temporary folder" is needed if you do not have so much space on the main disk. During the analysis, the program processes a large amount of information: it unpacks and extracts various files, taking up a lot of space. The temporary folder is used to store these same files.
As an option - you can use the hard drive used for ng bigger size as a temporary folder. The main thing is that this disk is not scannable.
By the way, with the “clear folder” button you can wipe the software's tempo files.
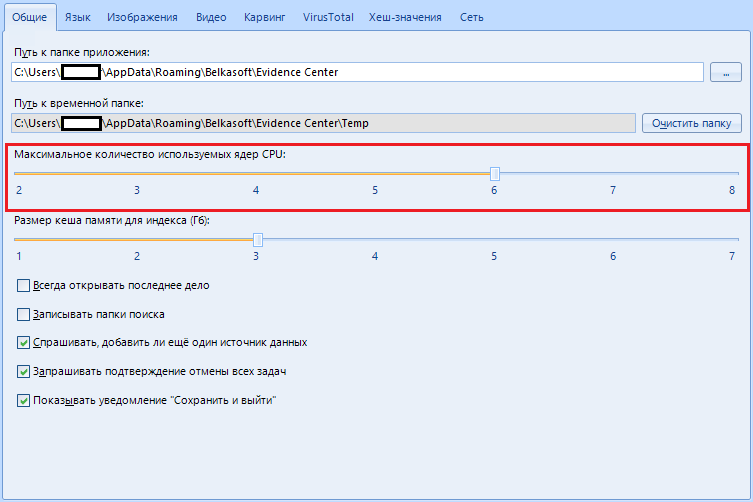
Next we have “Maximum number of CPU cores used”.
With this parameter, we indicate how many resources the program should consume. You can choose from two cores up to the maximum number of cores installed on your machine.
Why two? And here it is interesting.
The Evidence Center reserves one core for the user interface. Also, if you have a powerful machine with a whole bunch of processors (there are such, google), then in this case the hard disk will suffer, therefore the creators of this program recommend reducing the number of used cores to half.
I have eight cores, I indicate 6.
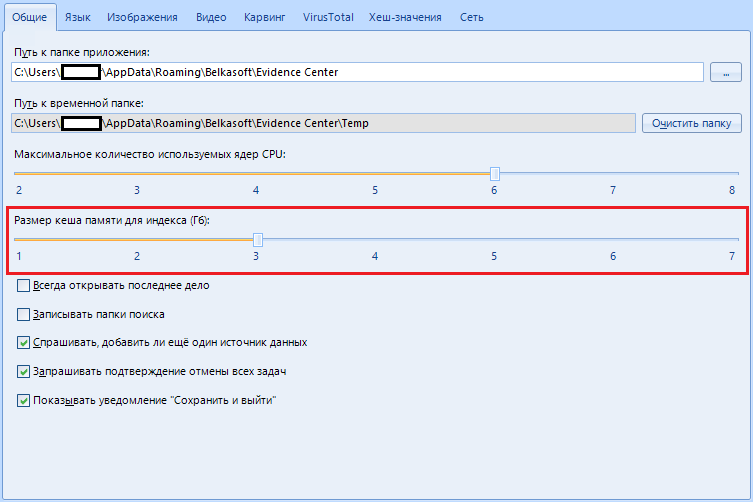
Item "Size of cache memory for indexing (GB)".
The program uses the sophisticated ElasticSearch mechanism (For dummies, this is a big data search engine (also known as “Big Data”), an analytical NoSQL DBMS that has a huge set of search functions), which obviously requires a lot of memory.
If you have a small amount of memory, we configure this program to use a smaller amount, otherwise there will be errors.
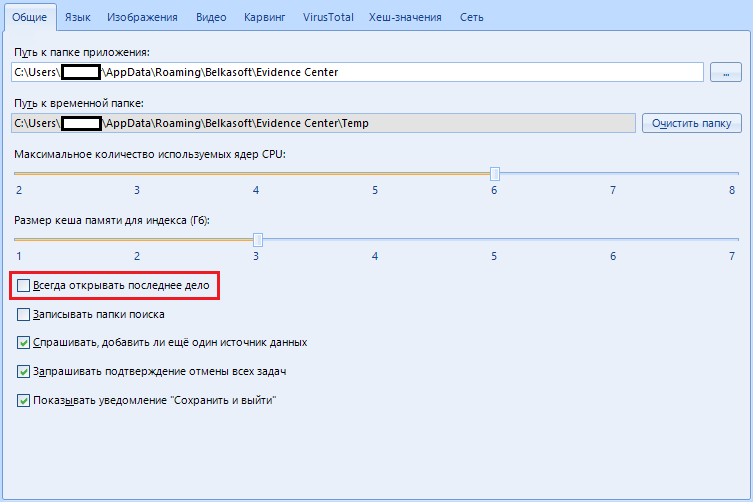
“Always open the last case” - when the program starts, your last case will be opened.
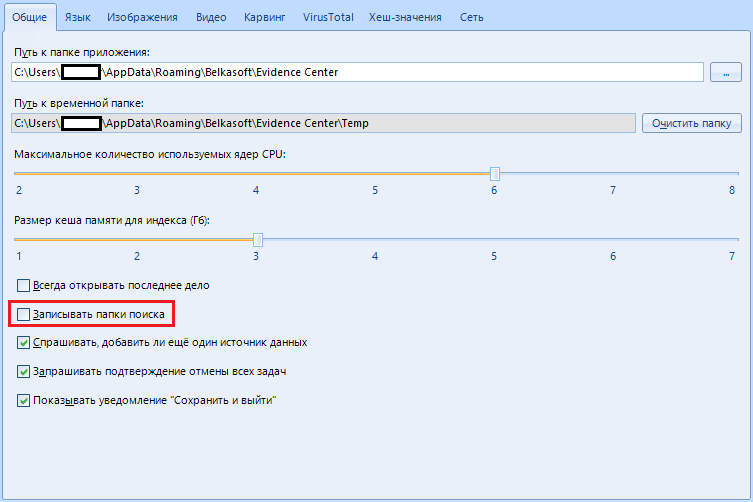
“Record search folders” - in my heart I don’t know what it is, honestly. The creators say this is for debugging purposes.
In short, we pass by, there is nothing interesting here.
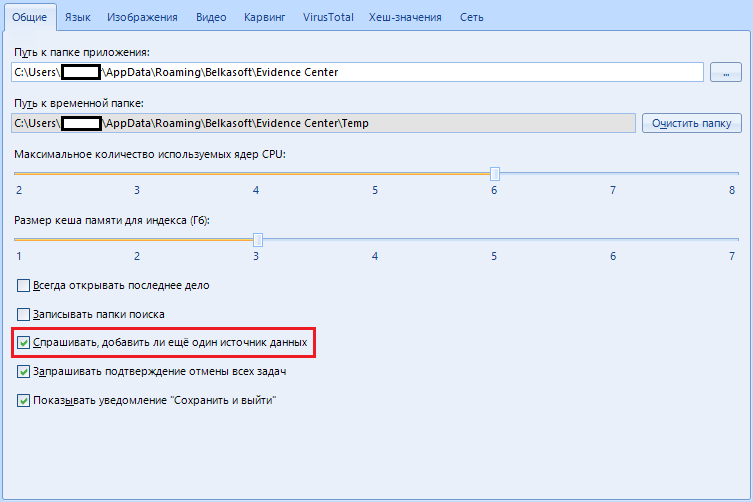
“Ask if I want to add another data source” .
When you select a medium, the program will prompt you to select an additional one in order to scan several at once. It can be convenient if you have a lot of work. We can leave this item on. If anything - it can be disabled after the first request to add an additional data source.
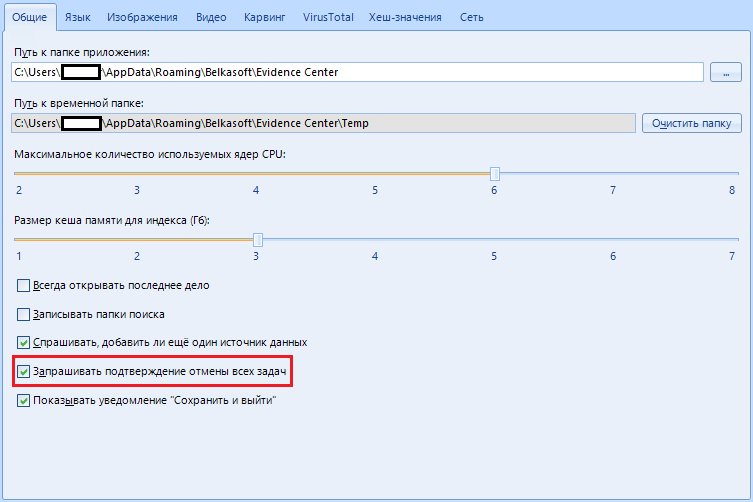
The item "Request confirmation of cancellation of all tasks" is needed only if you are afraid of accidentally stopping scanning. If the item is active, when canceling scanning tasks, the program will ask if you really want it or if you were just joking.
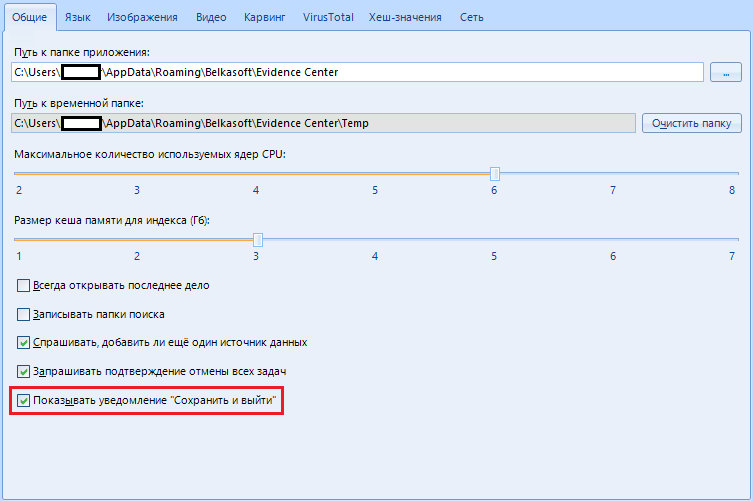
The item “Show notification 'Save and exit'” exists for the same paranoid who are afraid to accidentally end the scanning process. Before closing, the program will offer to save the result, thereby preventing accidental closing.
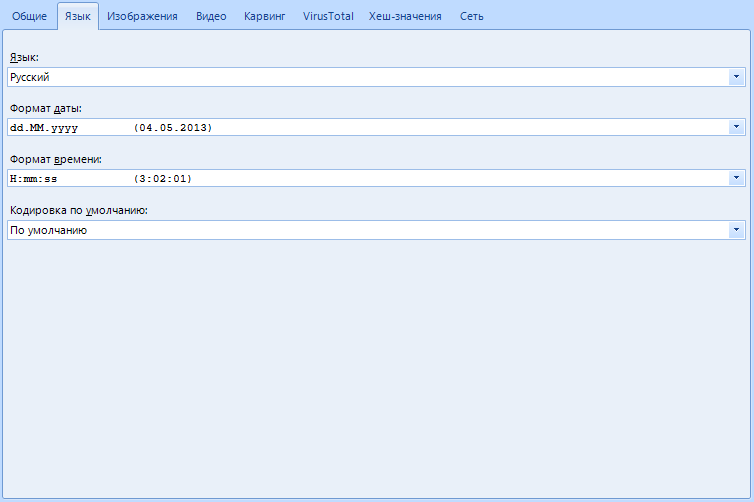
The next page is next. "Language"
These functions are needed solely to customize the appearance, they do not have any effect on the operation of the program. But I will consider this point as well.
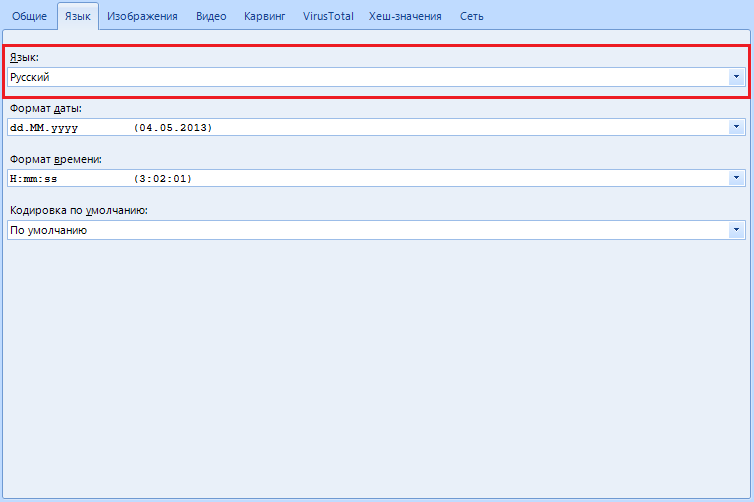
In the “Language” item , you can select the program language with which it is convenient for you to work.
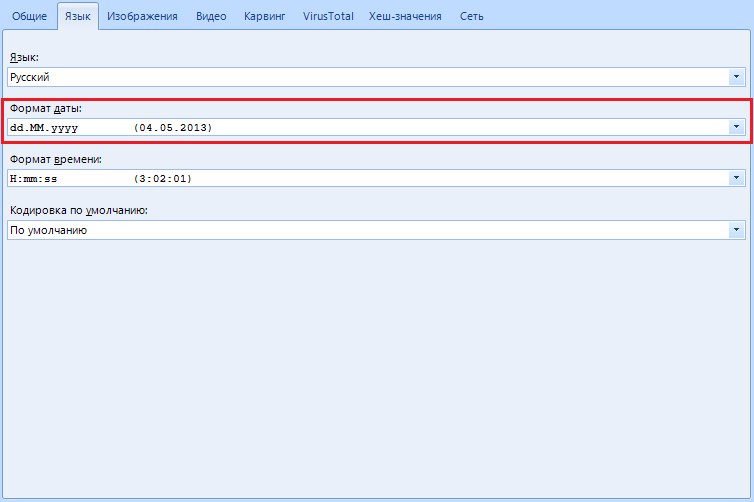
“Date Format” allows you to change the recording format and date display. In the United States, for example, the recording format is not day: month: year, but month: day: year, so if you are an American, you can customize this item for yourself. In addition, the setting allows you to select a separator between time intervals: starting from a point, ending with a hyphen.
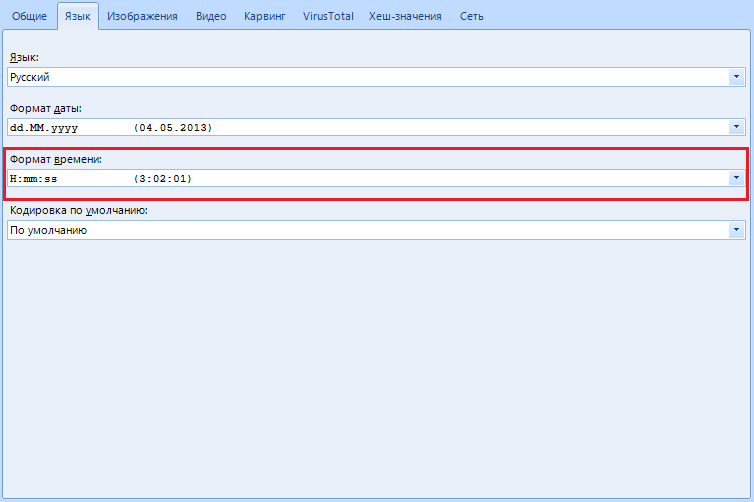
“Time format” is the same as with the previous item, but we customize the time display.
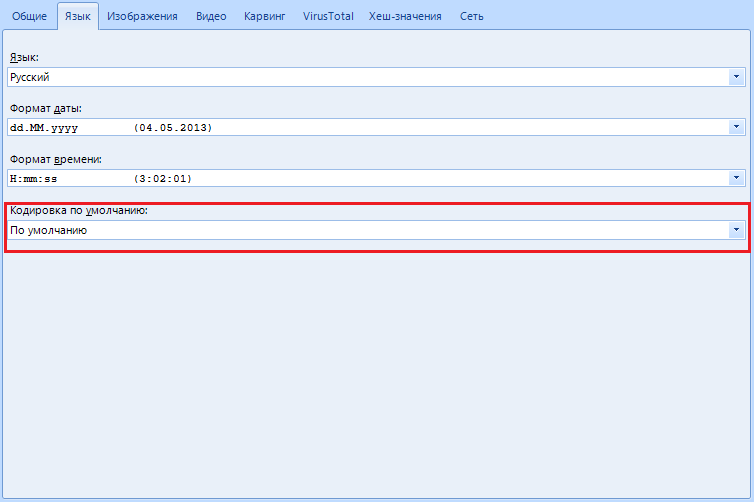
“Default encoding ” - setting the encoding of the displayed text data. I advise you to leave it as it is and not touch it.
Now the tab (or page, whichever is more convenient) "Images"
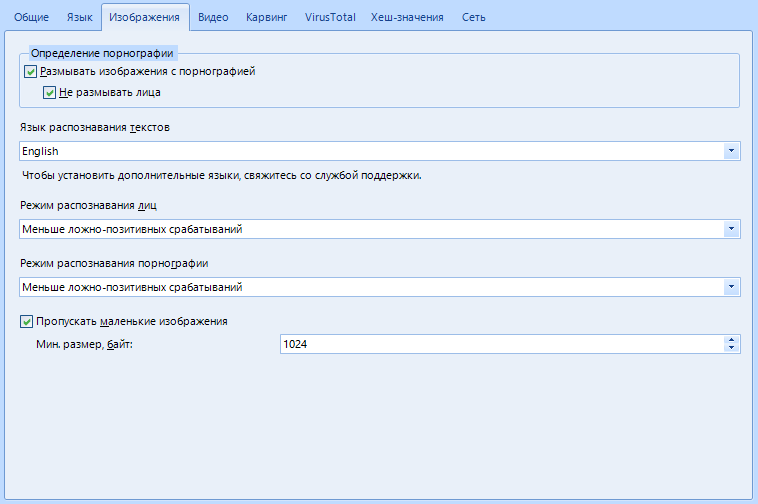
Here you will be setting up work with images found on the media.
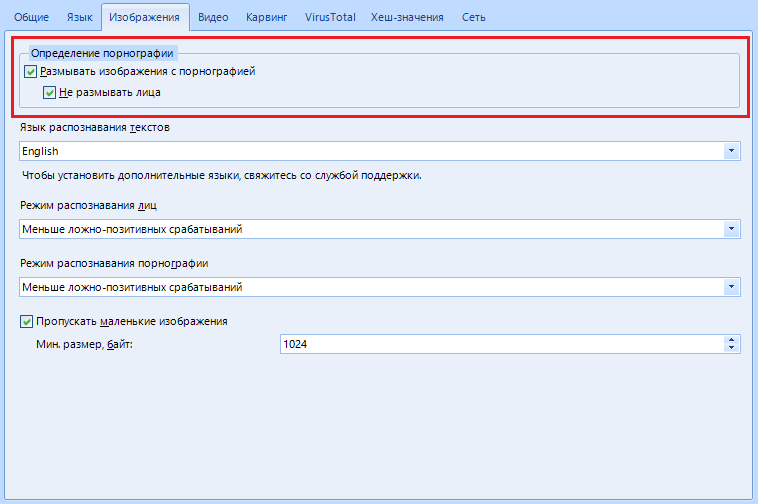
"Definition of pornography" allows you to blur all frames or everything except faces if you are a particularly shy person
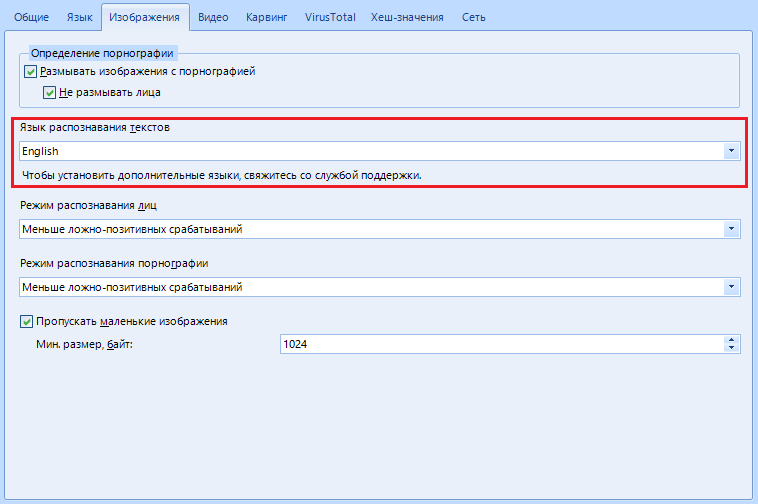
The default “OCR Language” is English. To install another - you will need to download the language pack, but for this you need to contact support. In this article, I am your support, so stay there, we have not even come to the middle of the article, and some, I see, are already tired

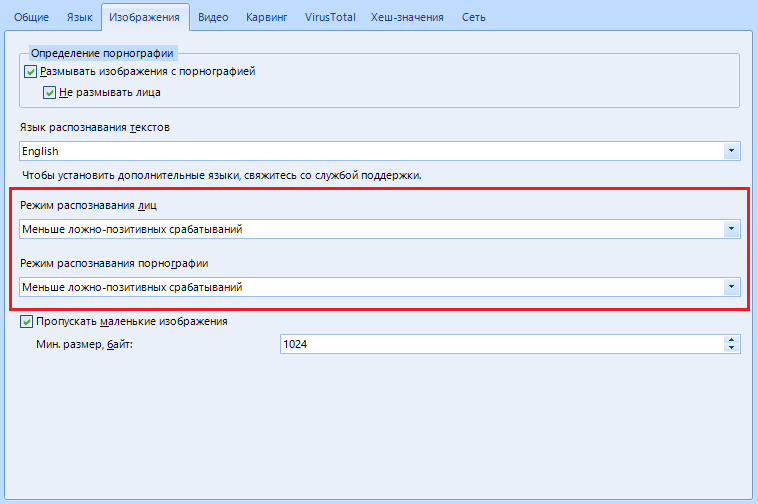
I have combined "Face / Pornography Mode" into one item because of the identical work and settings, as well as because I can afford it. There are only three settings: Fewer false positives , average or more . This means that the program is ready to cover up any photos and pictures where there is a hint of pornography or to identify faces even where there are theoretically none. Come on, make a schizophrenic out of the program.
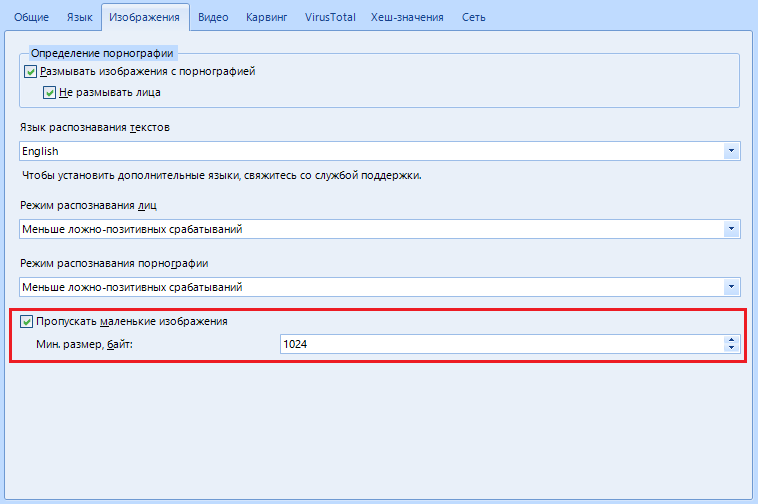
"Skip small images" - the program will skip all images, the size of which is less than the minimum specified, so as not to waste time on a knowingly useless resource.
That's all with that. Turning the page to "Video"
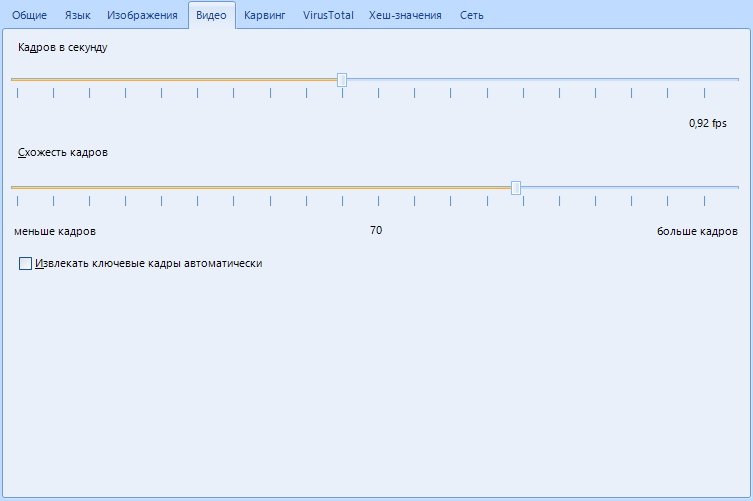
As you can tell by the name, this is the setting for working with found video files
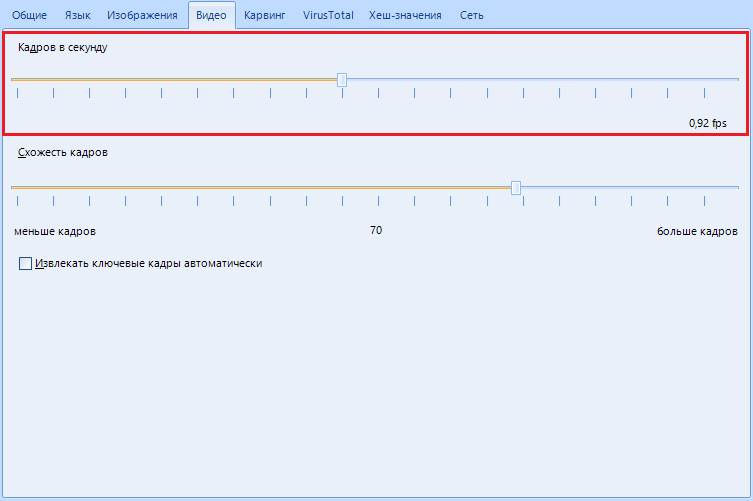
“Frames per second” is used to extract keyframes from a video. Here we indicate how many frames per second the program will process. This function can be described for a long time: how the program processes frames, and how it searches for a key one. Let me put it simply. The settings of this function suit us, we leave it as it is.
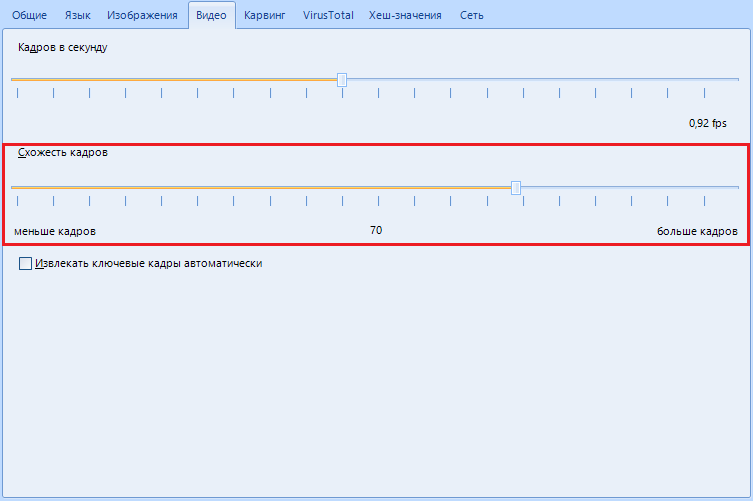
“Frame similarity” indicates how different two frames must be to say that they are both key, in how. In short, do not hesitate, leave it as it is.
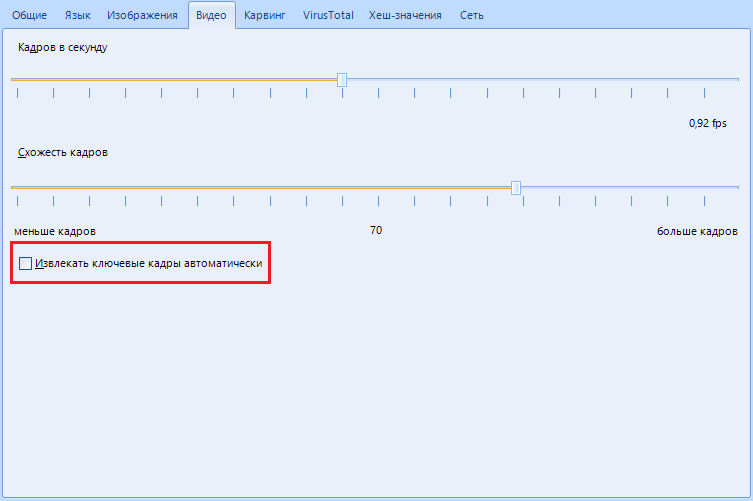
"Extract keyframes automatically" - only necessary if you work a lot with video,using this software as a home theater . This item allows us to configure Evidence Center to automatically extract keyframes from previously found video files. But please note that there can be as many such files, so the software is ready to just sit right down to extract key frames. To avoid embarrassment, disable this item.
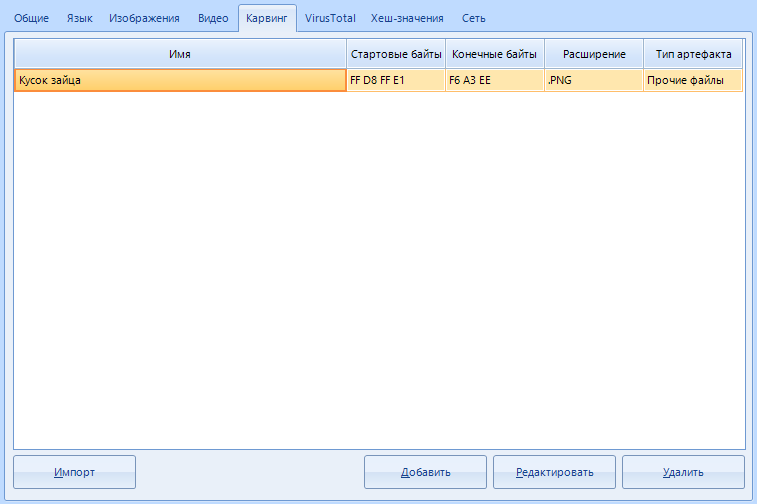
Moving on to the “Carving” tab, we get to the end of the settings overview. By the way, the second half is more difficult than the first.
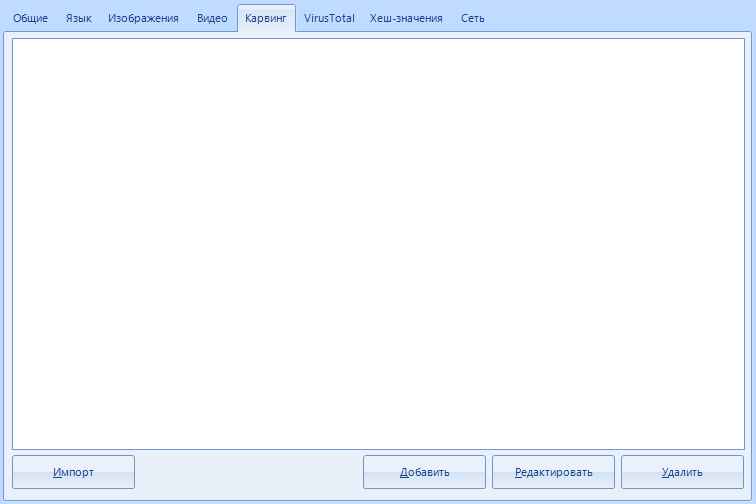
Do you think that if there are only a couple of buttons in this tab, then there will be little text? You are wrong. Here we will set up signatures for carving.
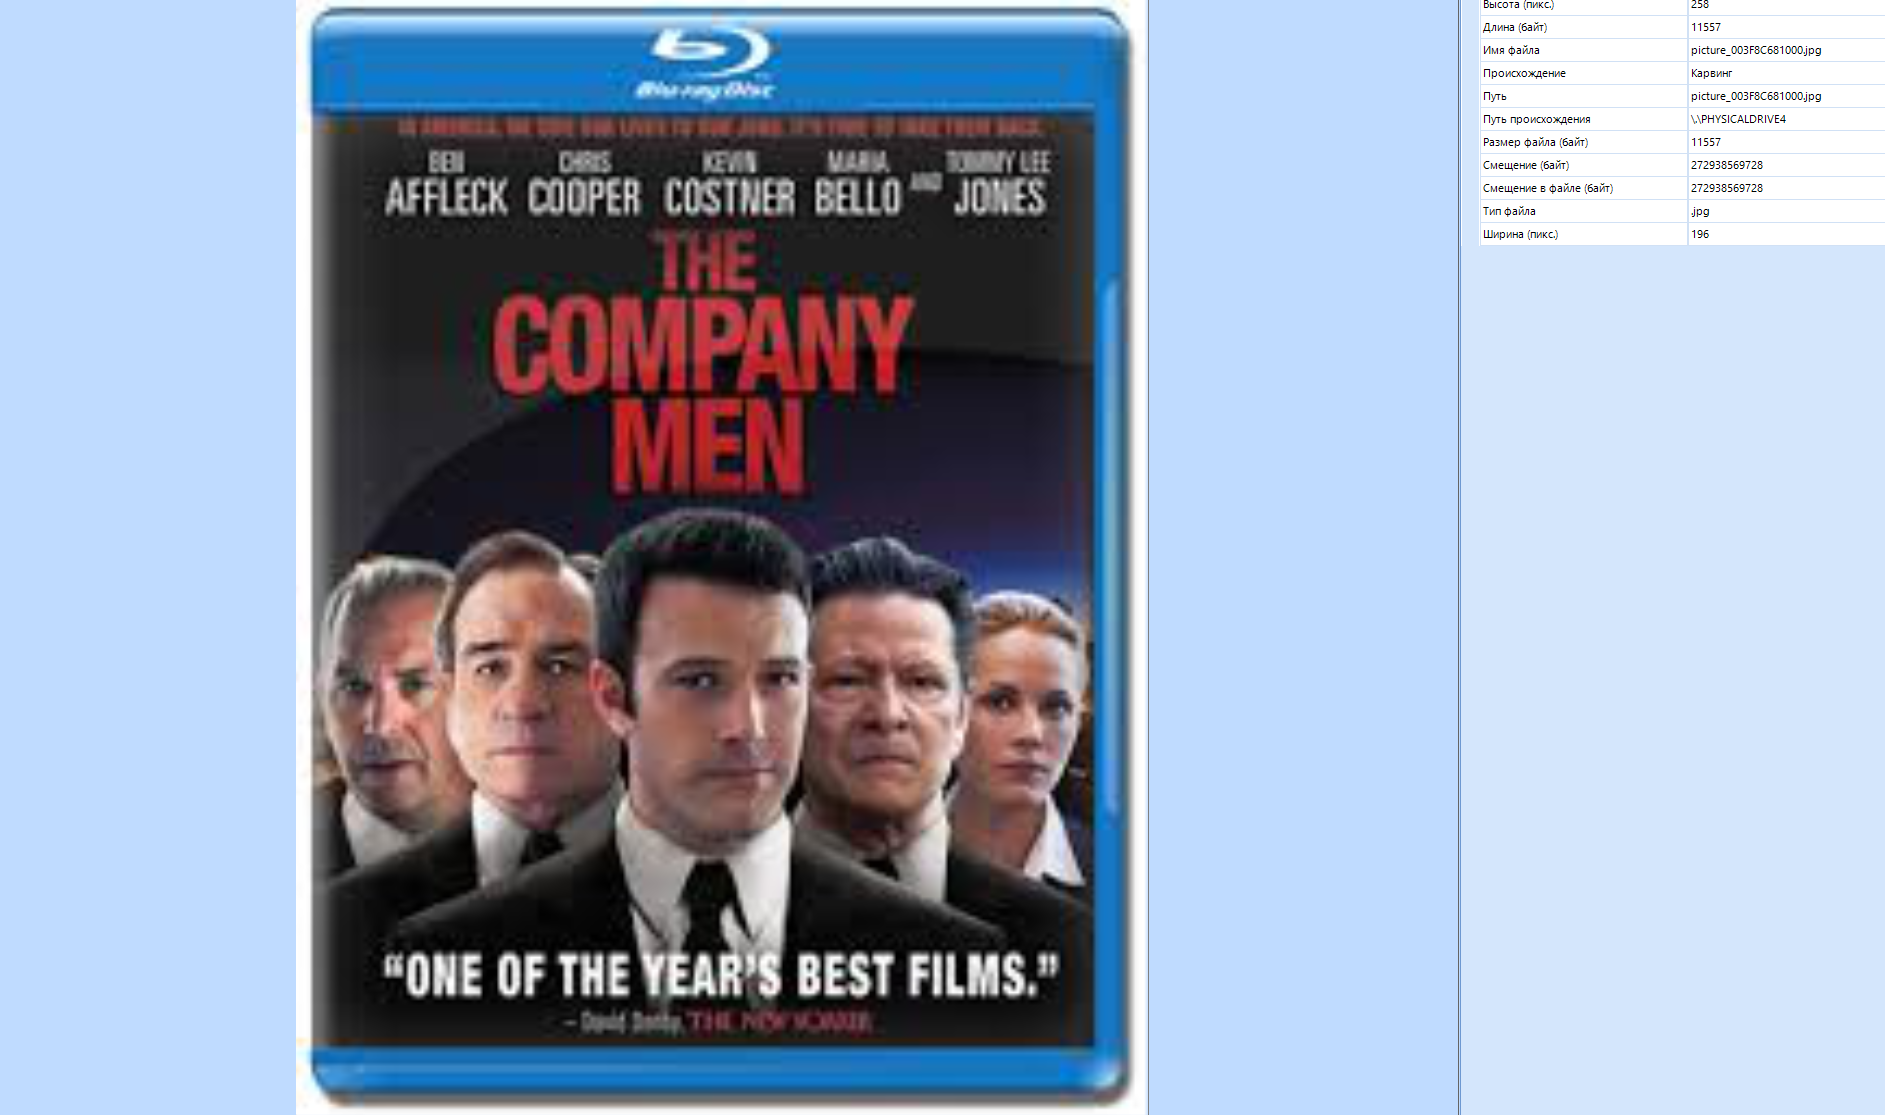
" Carving " is an algorithm for data recovery. It is based on file signature search, or signature search. Usually, when restoring, they work exclusively with the data saved in the file system. In the same case, the algorithm processes the entire data array by reading the entire surface of the hard disk. Here we indicate where the file we need begins and how it ends, so that the program knocks out exactly what we need from the data monolith.
Unfortunately, as cool as this algorithm is, the results may be incomplete. In addition, false positives are possible.
For example, we set the initial bytes for the search in the settings and start carving. Work begins and at some point the program stumbles upon a txt file, in the text of which the initial bytes we specified earlier are found. Then the file will be incorrectly identified and a false result will be given.
Such mistakes are frequent guests. You can observe them yourself when you start examining the recovered correspondence data. BEC (Belkasoft Evidence Center) collects such errors there. You can recognize this by hieroglyphs instead of text and / or username, a strange set of numbers and the absence of a username. Do not be afraid, because as Malysheva says - “This is the norm”. The main thing is that this does not affect the final result.
Let's pay attention to the work area.
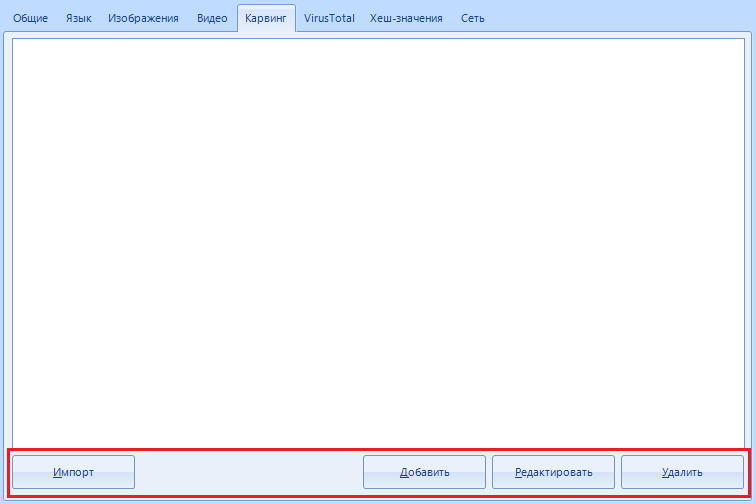
Using the buttons at the bottom of the window, we can import signature sets, add new ones (we will dwell on this point in more detail) or edit existing signatures for search. For those who do not understand - here we set the data by which the search will be performed.
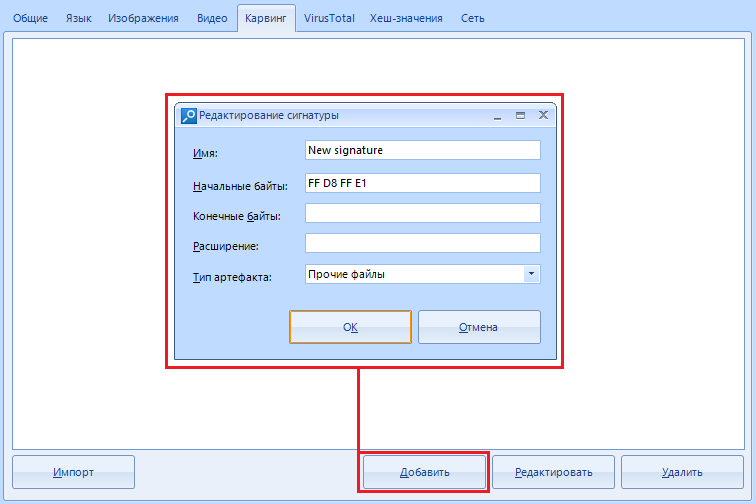
By clicking on the "Add" button, we open a new window where we will indicate the necessary data.
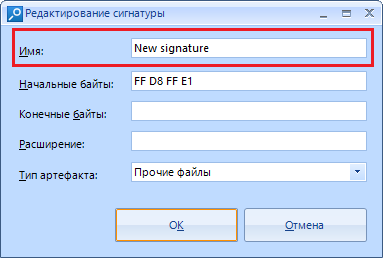
The field with the name “Name” is optional. Think of it as just the name of the search setting you are adding.
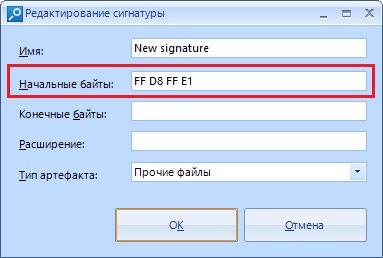
"Initial bytes" - data in the form of a hexadecimal string, from which the data we need begins.
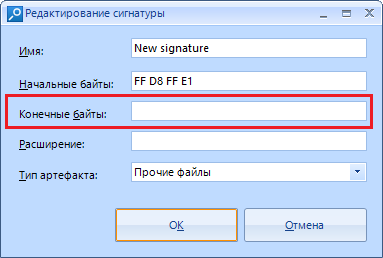
"Trailing bytes" are optional data, but if you know them, you can specify them in this field. Everything is the same in hexadecimal form.
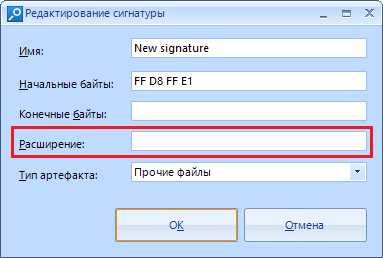
In the line “extension” we enter the extension into which the program will save the cut piece of data, for example, .PNG
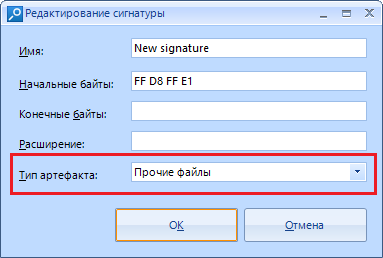
“Artifact type” is a hint for the program what kind of data we are looking for and where to show the cut result. By default, those recovered using this method are labeled “other files”.
Here is an example of a ready-made carving settings item. You can leave out everything that I wrote above. This is for general development.
We can go to the page "VirusTotal"
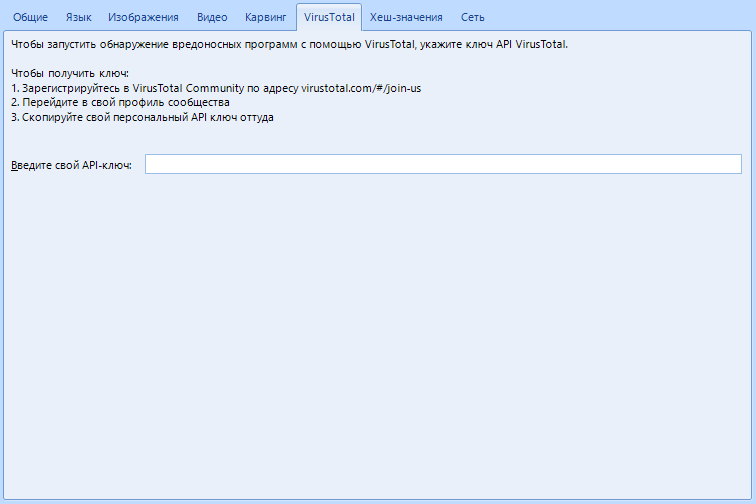
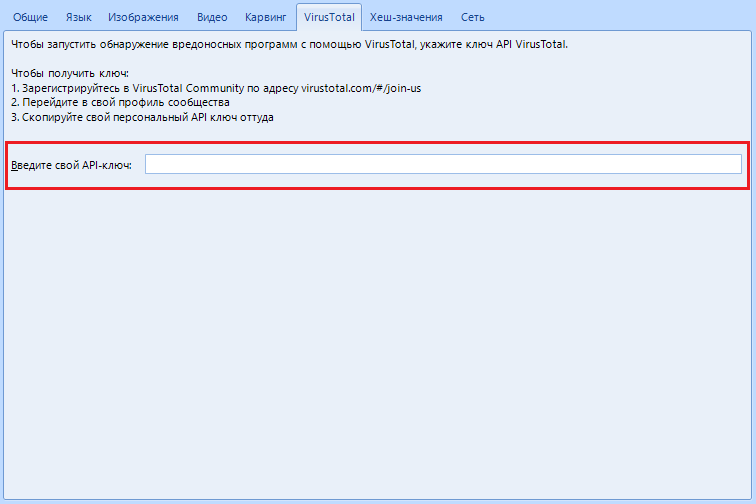
There is only one field where you need to enter the API key to work with the VirusTotal service. Thanks to this feature, all .exe files will be scanned for viruses. It's nice that there are instructions on how to get the key right in this tab. Everything for people, thanks to the developers.
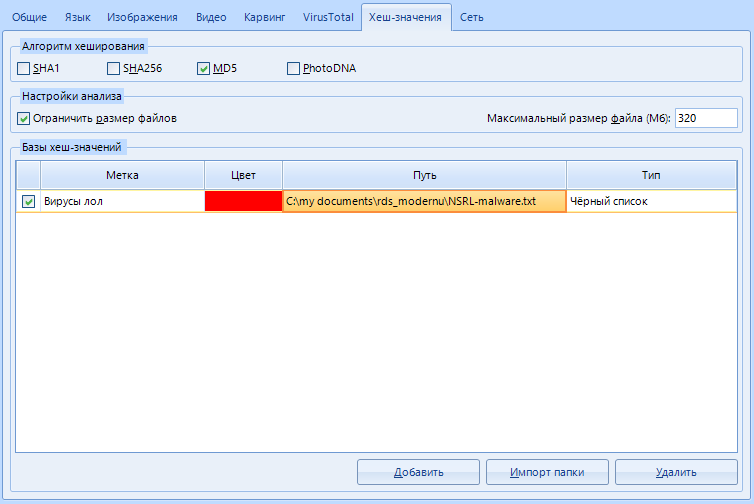
Penultimate page. Hash values.
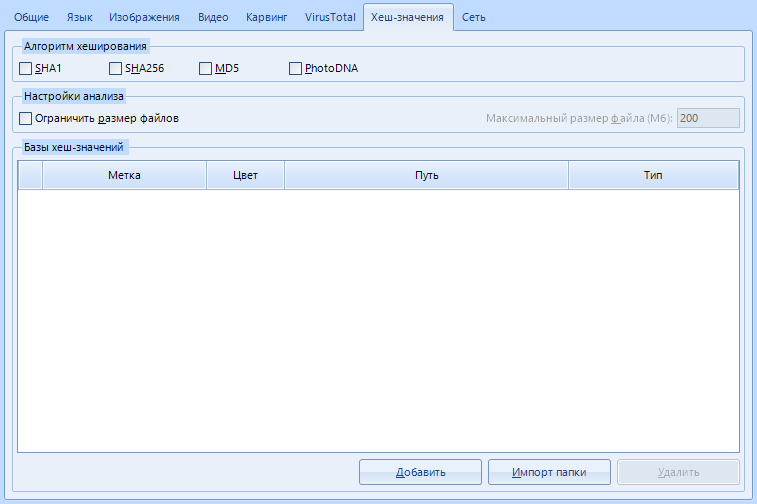
You know what a hash is, right? No, it's not me. Can you distinguish MD5 from SHA256? Excellent. This item allows you to find specific files using a predefined set of hashes.
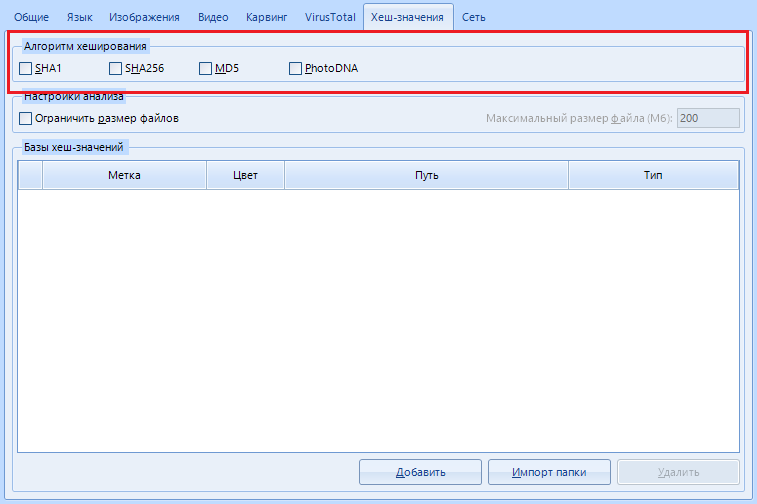
"Hashing Algorithm" . Here you can specify which hashing algorithms to use when calculating file hashes. The fourth and last option, PhotoDNA , deserves special attention . This is a function to compute the hash value exclusively from media files (images, video and audio files). It is quite rare, but it continues to be used.
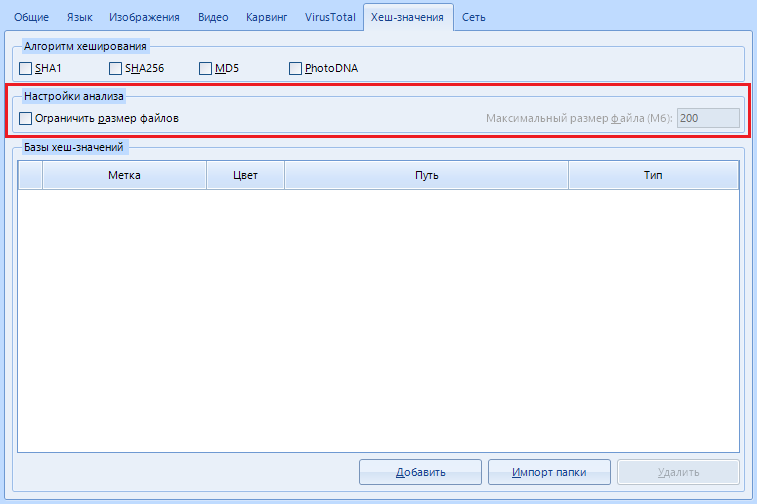
"Analysis settings" .
In this menu, you can set file size limits for calculating hashes, which can improve performance. For example, what's the point in calculating the hash of a 200GB file?
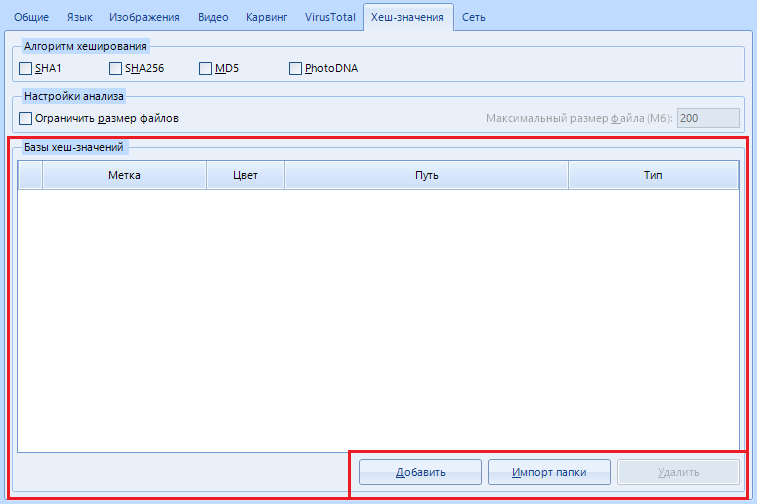
"Bases of hash values" - add , delete or import a list of hashes for searching using the buttons in the lower right corner.
After clicking on the "Add" button , the following window opens:
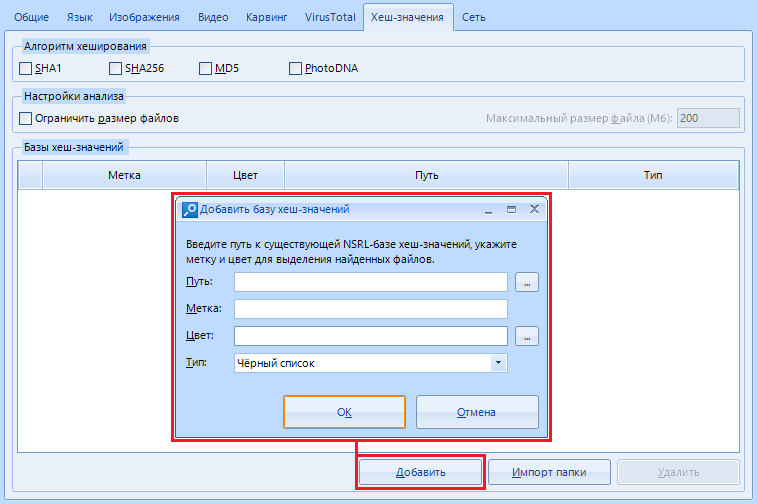
Let's study it too.
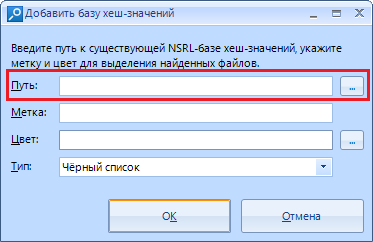
The string "Path" is the path to the file with values. Yes, you won't be able to add it by the piece.
Warning: Only the NSRL (National Software Reference Library) dataset is allowed . Who does not know - this is a huge repository of known and proven software. For example, you can load data about system libraries and immediately mark them as “white” (safe) files.
Yes, this is the identification of files by hash value
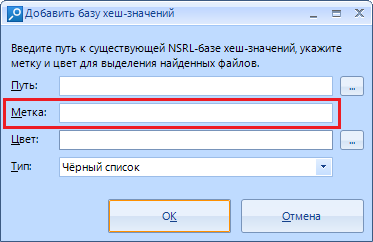
"Label". Consider it just a name that will be assigned to the found files by hashes. For example, we can name this shortcut “System” if we downloaded data about them.
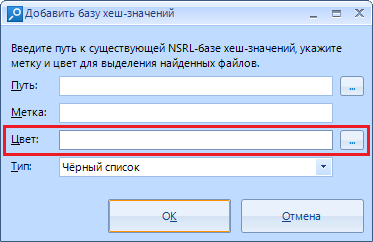
The color with which the results will be marked.
By the way, we will choose from here:
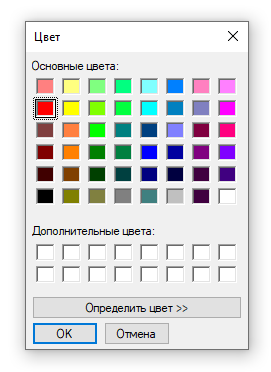
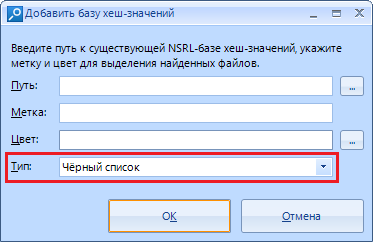
"Type".
Thanks to this setting, we can choose which list the results will belong to: a whitelist or a blacklist .
Here is an example of the data loaded. But, as you understand, we do not need it yet, we skip it.
The finish line of the settings, go to the last tab “Network”
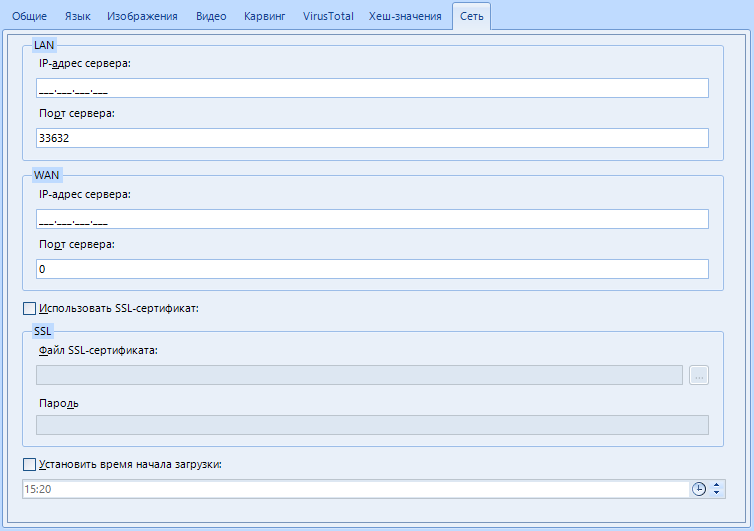
Yes, the program supports remote data collection.
This is the server setup for remote scanning. LAN is also supported. I don’t think it’s necessary to explain how they differ. As you understand, the server will be the computer from which the scan will be carried out.
We configure this item. We will need this later.
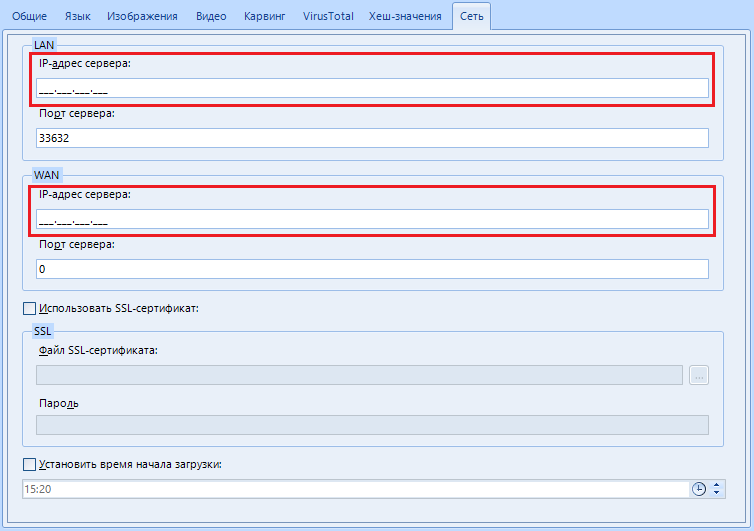
Setting named “Server IP Address”.
Here we indicate the IP address of your computer on the network. If you are on the same local network, this might be your local IP. Well, or external. Depends on the occasion and purpose.
Where to get your IP from?
Win + r -> CMD-> IPconfig, IPv4 address.
I must warn you that the mask does not work very well, and you will have to write empty spaces with zeros.
For example, I am using LAN scan and my IP on the network is 92.168.1.6. In the setting, I enter 192.168.001.006
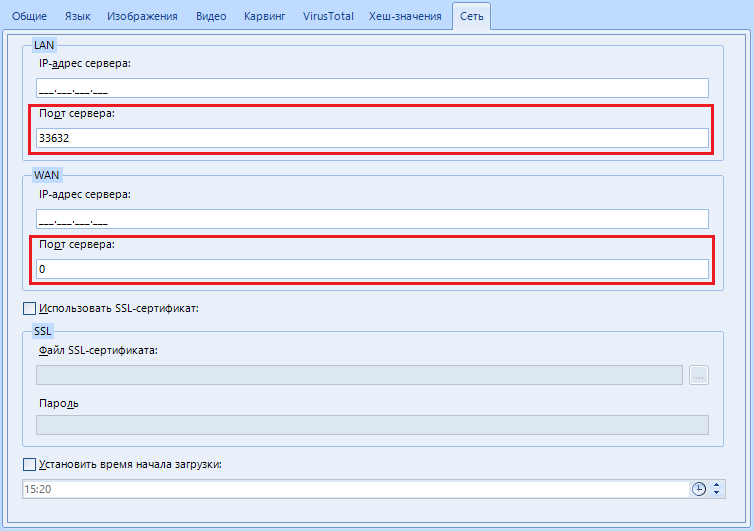
"Server port". In addition to the IP address, here you can specify the port that will be used for remote work. By default, I use port 33632.
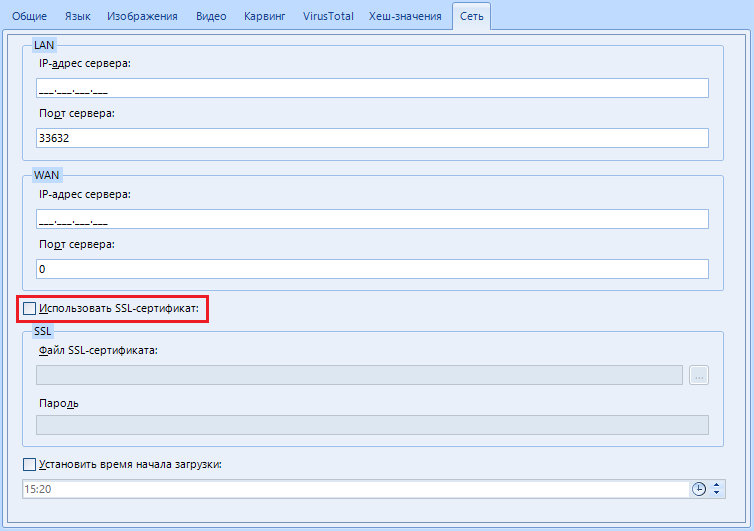
"Use SSL - certificate". You can encrypt communications between the remote and local computers using an SSL certificate. Cool, yeah?
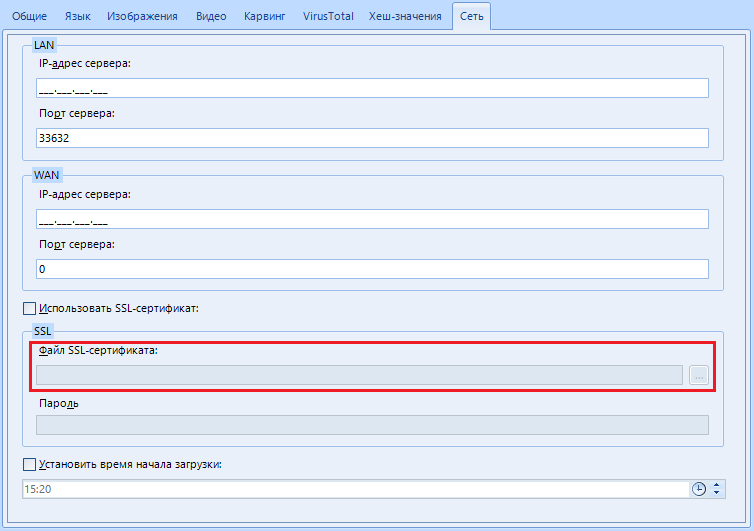
"SSL Certificate File". Here we specify the path or select the SSL certificate file
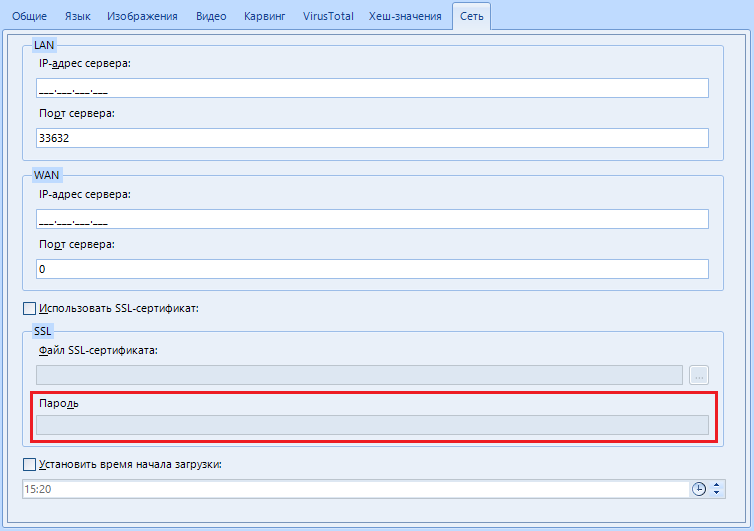
"Password". The password for the previously specified SSL certificate.
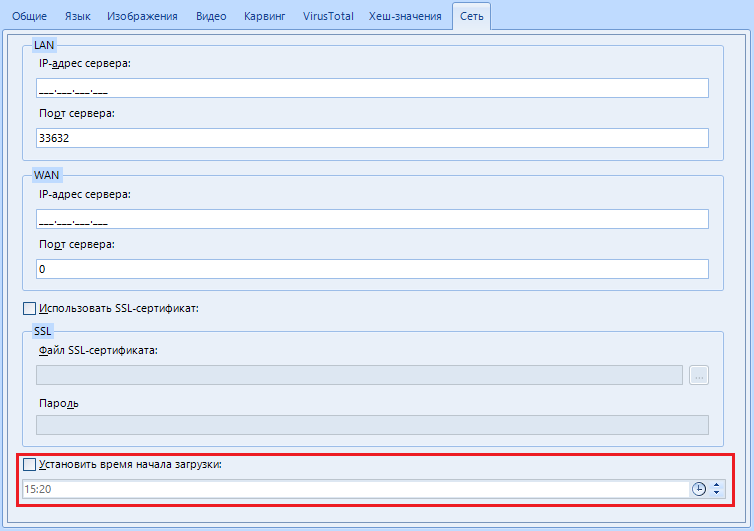
“Set download start time”. Like a timer bomb. Set the download start time and wait.
To save the settings - click on the "Apply" button at the very bottom:
We're done with the settings!
We will consider the rest of the functions during the main work.
In order to get started, select the “New Business” function in the “Main” menu (exactly as we discussed earlier).
What's here but how do you know, so fill in the fields and click “Create and open”. We are waiting for the program to finish its calculations, and we begin to study the following window with a bunch of buttons and pictures:
According to the old tradition, we can divide it into two parts: left and right.
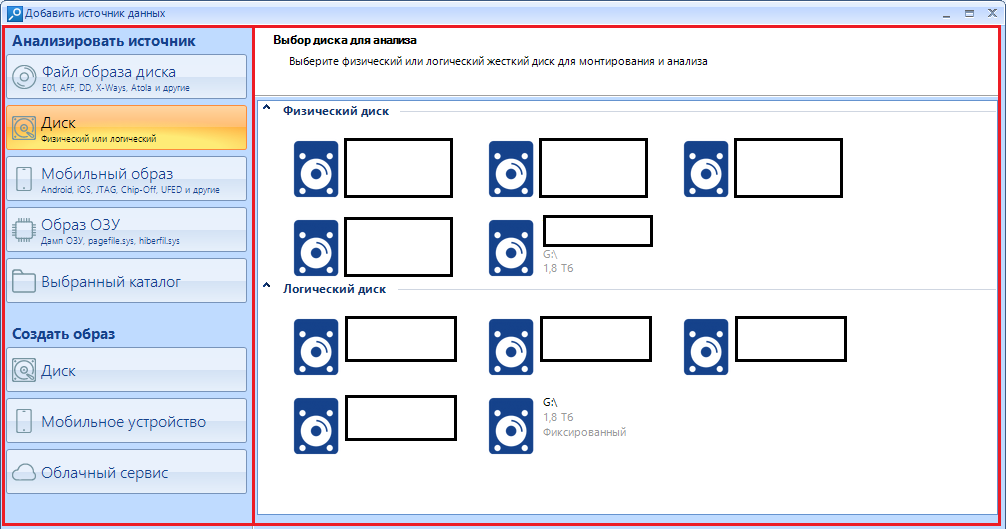
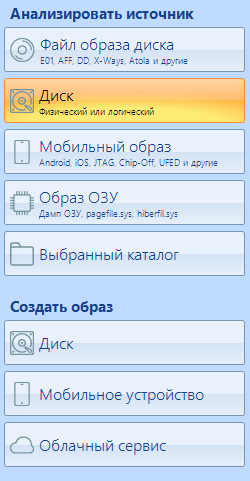
In the left work area, we select the source of the analyzed information:
And on the right, select the device or perform the necessary manipulations with the settings:
Let's explore all the possible options.
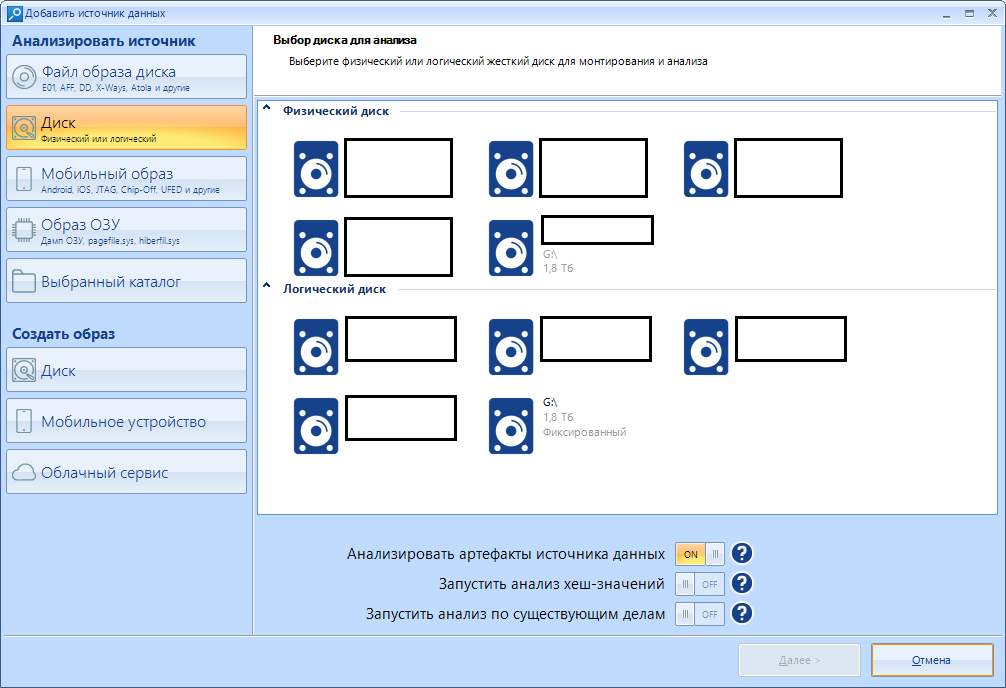
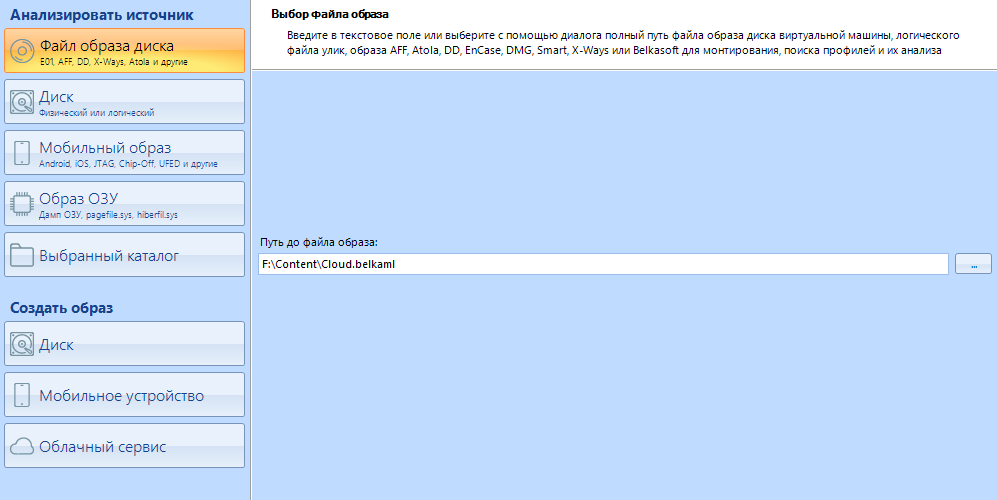
Let's start with the disk image files, the first item on the left:
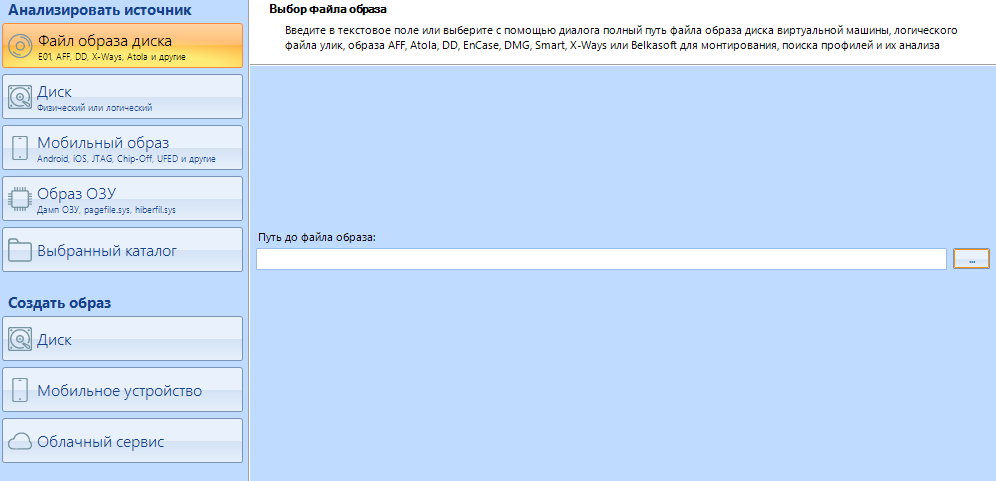
The program supports a huge number of extensions (7z, zip and tar archives are also supported). Just look at the amount! For every taste and color. No, I will not show you, see for yourself.
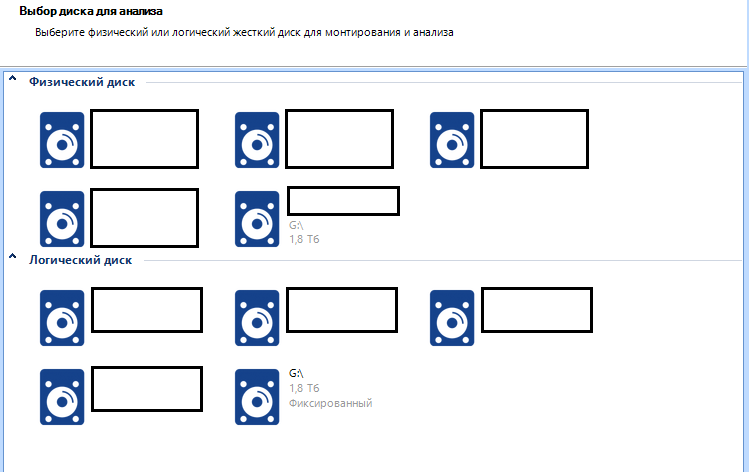
Disk.
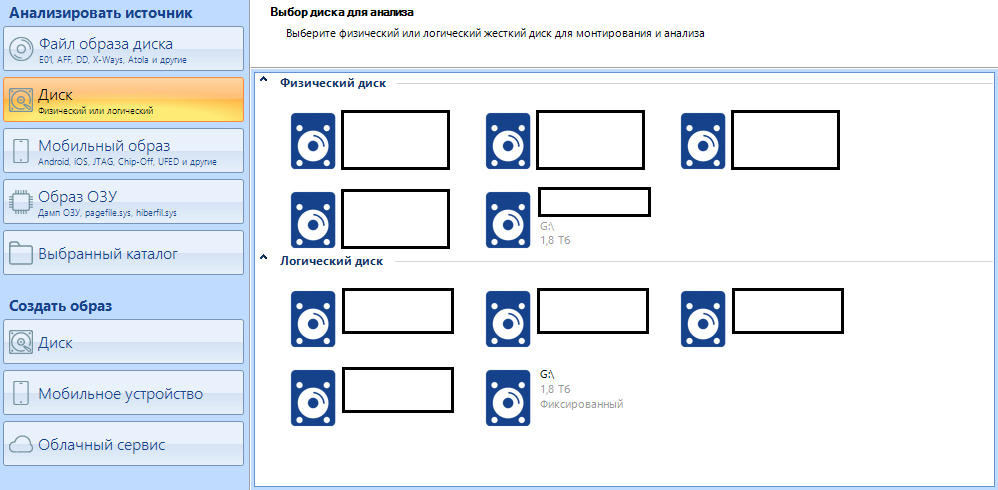
This is the main menu. All connected disks will be visible here, even if Explorer does not recognize them (This is usually due to a file system different from the one recognized by the operating system, for example, I can cite APFS, Apple's file system. Physically, the disk will be accessible, but it will not be logically recognized. However, as I said at the very beginning, the Evidence Center works with this system as well). Now I have a 1.8 terabyte disk inserted into my system. You can observe it both in the physical and in the logical selection menu. We will return to this a little later.
Mobile image
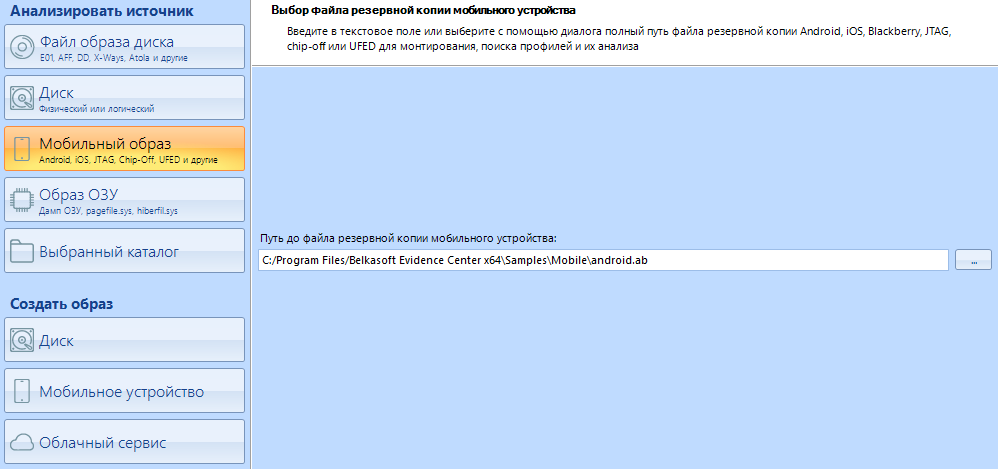
In addition to scanning disk images, Evidence Center can work with images of mobile devices. We will not work with them in this article. All for the same reason - I want to save this topic for a separate article.
RAM image
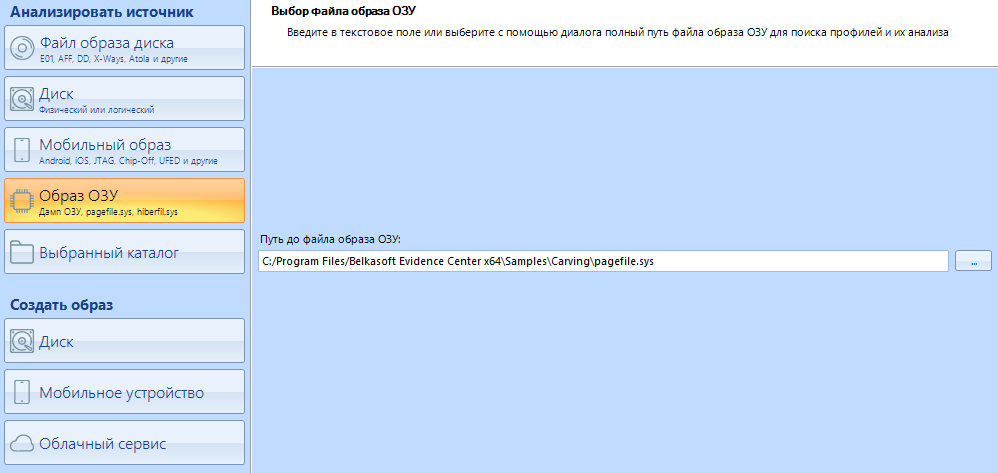
As with any other storage device, you can also take an image from the RAM. Belkasoft, for example, have released their utility for removing an image of RAM. We will consider this point later, but closer to the end.
Selected directory
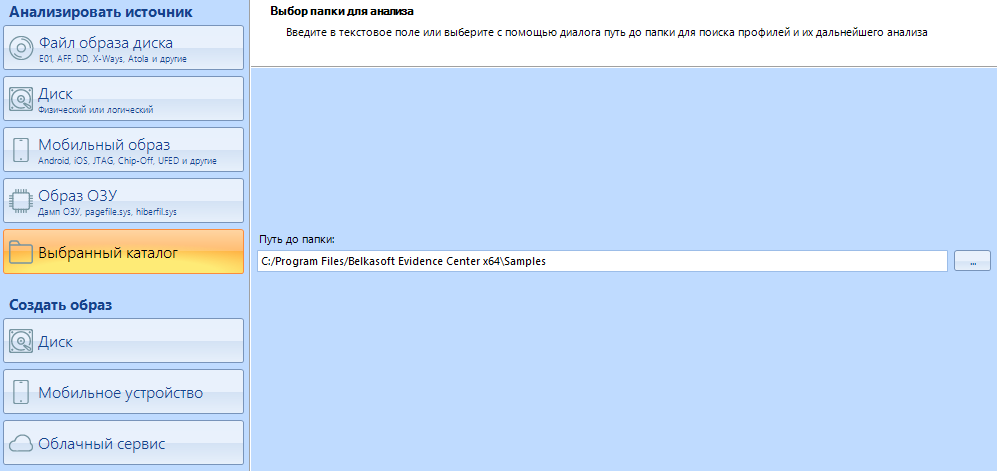
Using this item, you can specify the program as a scanning point not the entire disk, but only its separate directory. It is convenient when you are scanning not a separate disk, but one of the workers.
Go to the sub-item "Create an image"
Here you can create an image of various devices for subsequent scanning.
The first button is "Disk"
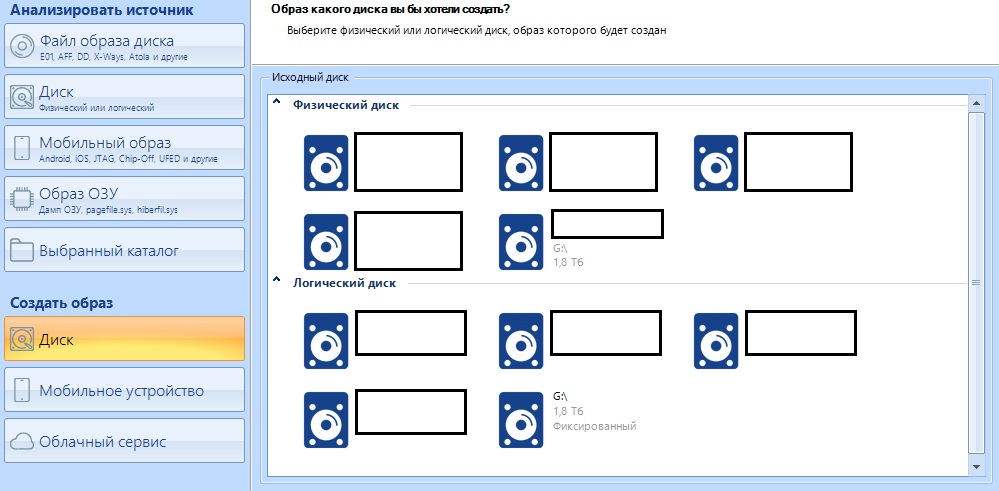
Here it is possible to make an image of the disc of our choice. We make the choice of the necessary in the right menu.
I hear the question "how next?" I’ll help you now.
After selecting the media, you see the following menu:
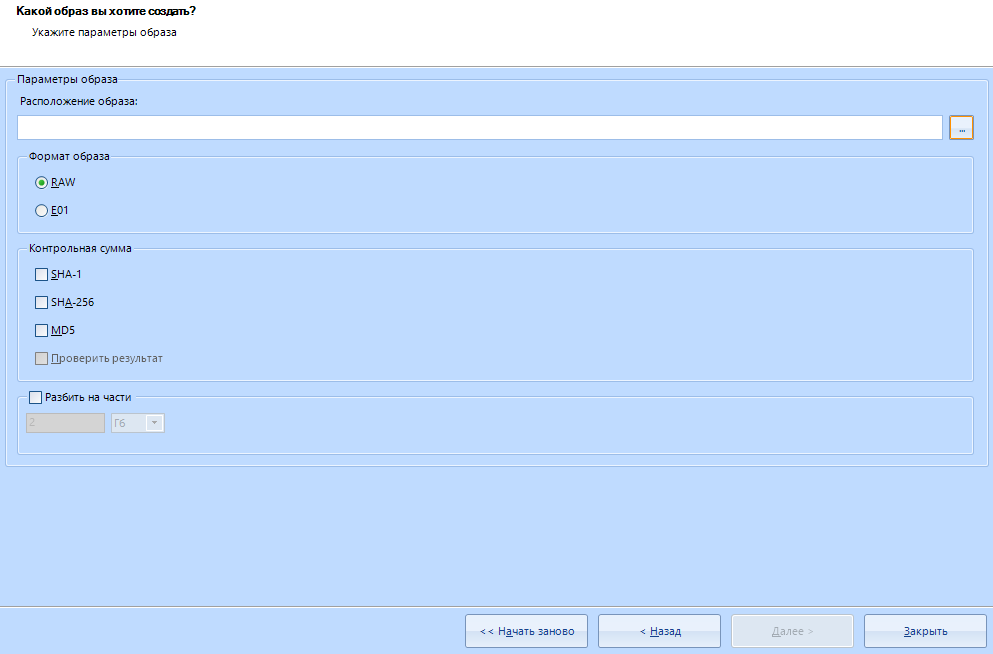
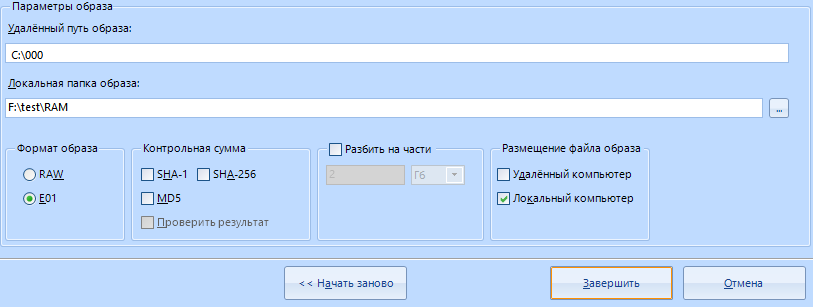
This is the disk imaging setup menu.
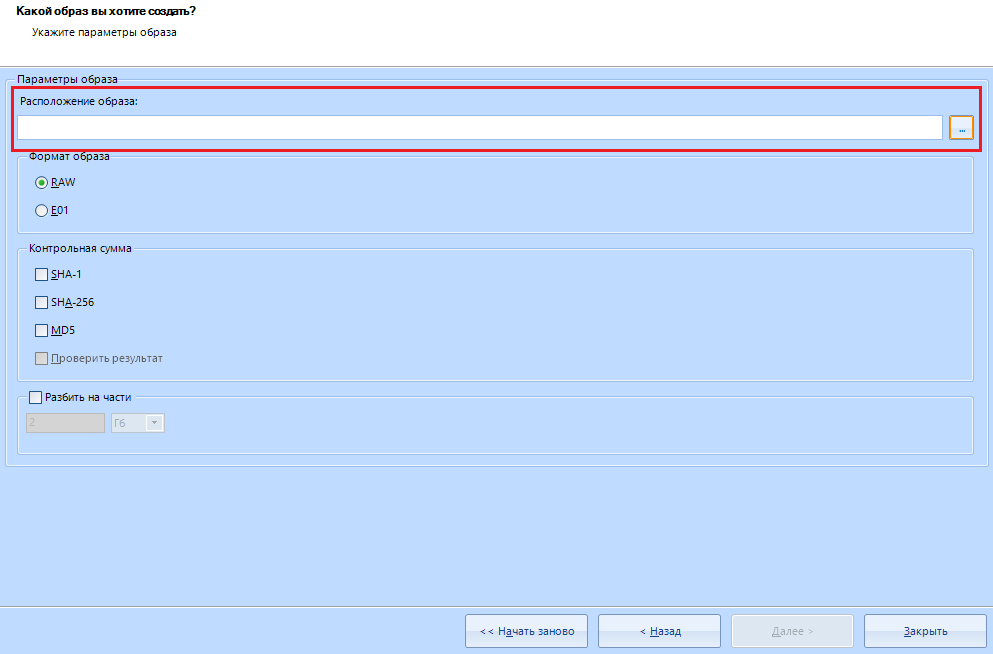
This is the location of the image . To choose where to save - click on this button:

Everything is simple here. We select the destination folder for saving and the name of the future file.
Evidence Center supports imaging in two different formats: RAW and E01.
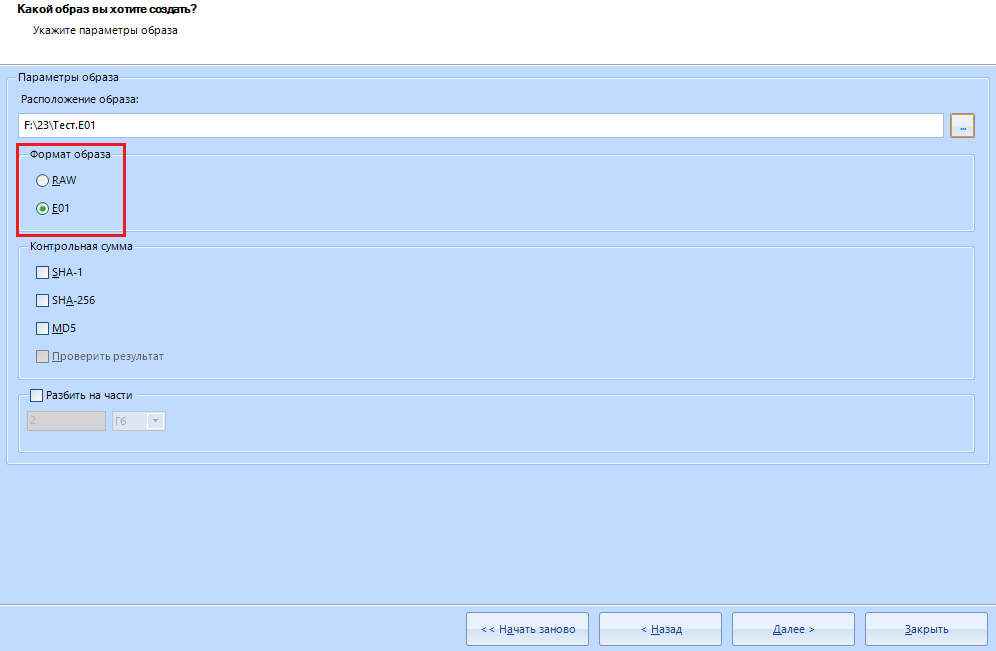
If you do not go further, then:
E01 - compressed format
RAW - uncompressed format
In my work, I always use a compressed image format, that is, the E01 format
" Checksum " can not touch. This is necessary to check the integrity of the files after creating the image.
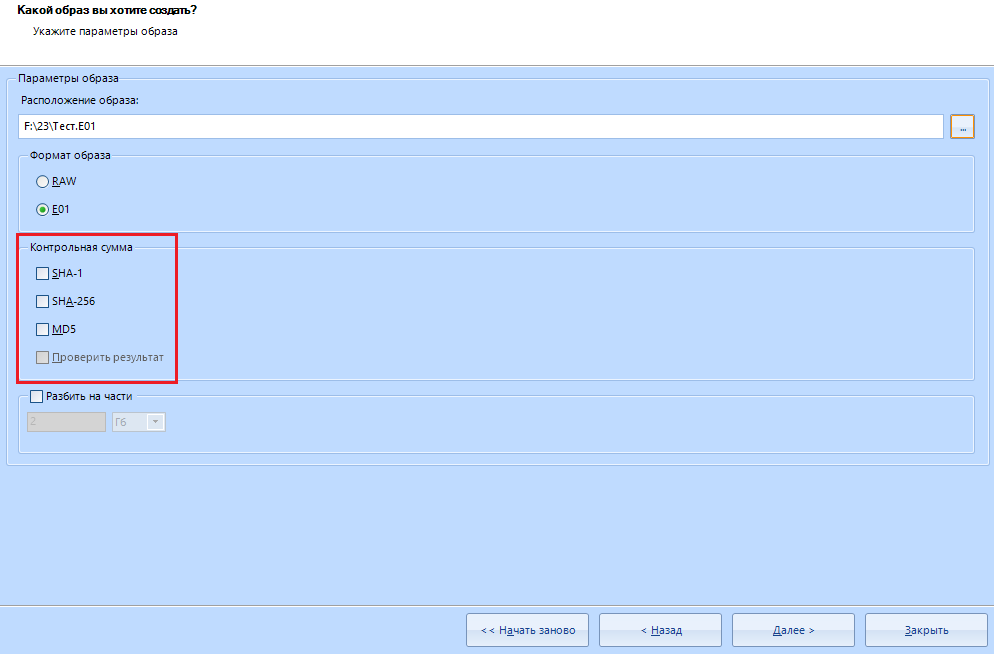
In addition, we can split our image into parts in this menu:
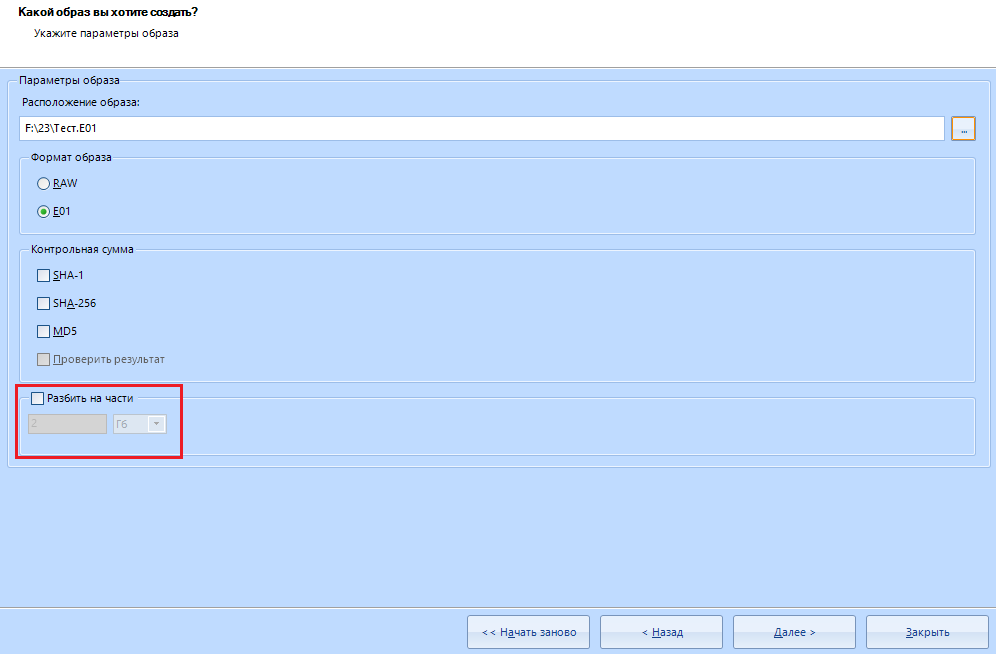
That's all with this item. You are great, to create the image you need to click on the "next" button.
Mobile device.
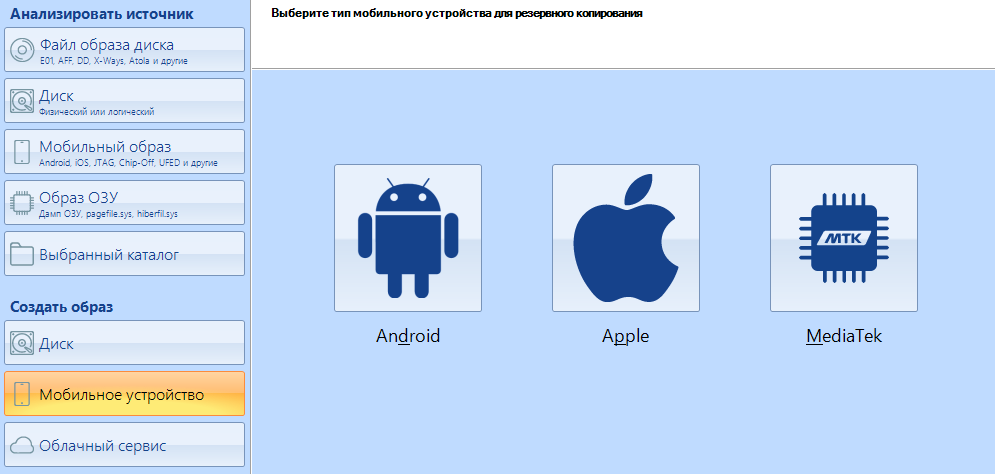
In this menu, you can select the device from which we will create the image. To make an image of a mobile device, you need to change the USB mode on the phone.
As you may have noticed, Evidence Center supports Apple's platform. Moreover, there is a built-in Checkm8 jailbreak . But, again, this is a topic for a separate article.
And now the juice itself. Cloud service
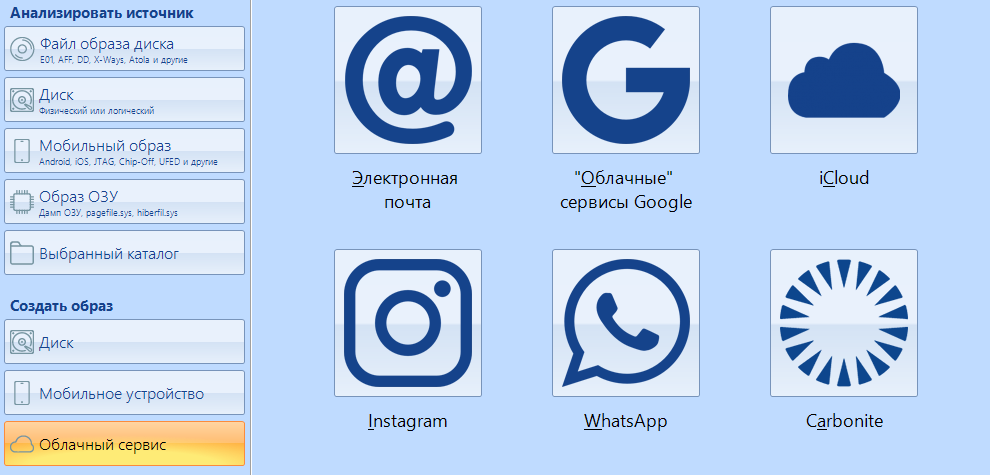
Using this item, you can make an image of not just a storage medium, but one of the services. For example, you can scan yourhacked account for content. How do you like that? Isn't it a hacker's weapon? Oh, I mean, an operative, yes, an operative.
We will evaluate the work of this item, we are still closer to the end of the article. I'm sure you will like it.
And now let's get down to the main work with the information carrier. In addition, we will analyze the remaining functions.
As I said earlier, the right menu for working with disks is divided into two items - Physical disk and logical .
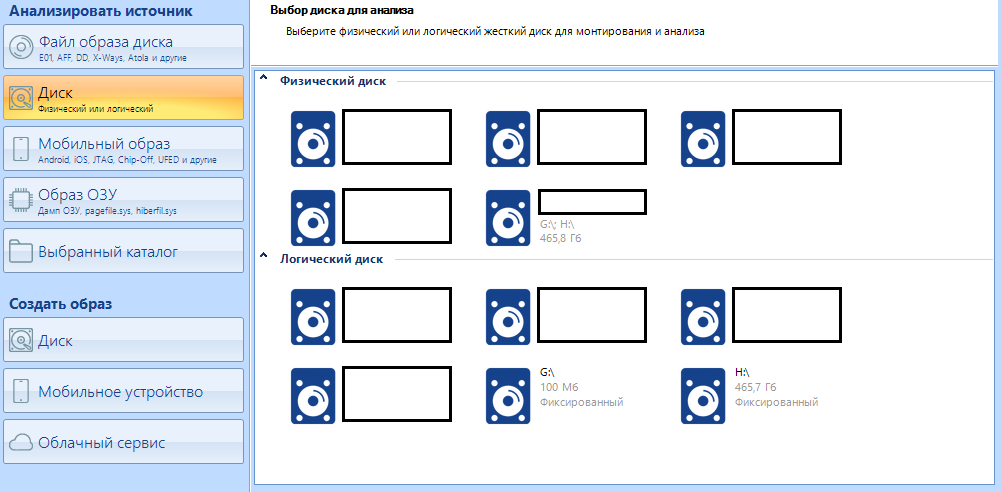
In case the disk is divided into two logical partitions, you can select the one we are interested in. By selecting one logical drive, we can select the second later as an additional one. In order not to do this, select a physical disk, then all logical ones will be scanned as one.
We click on the disk we need, wait for the end of the signature analysis.
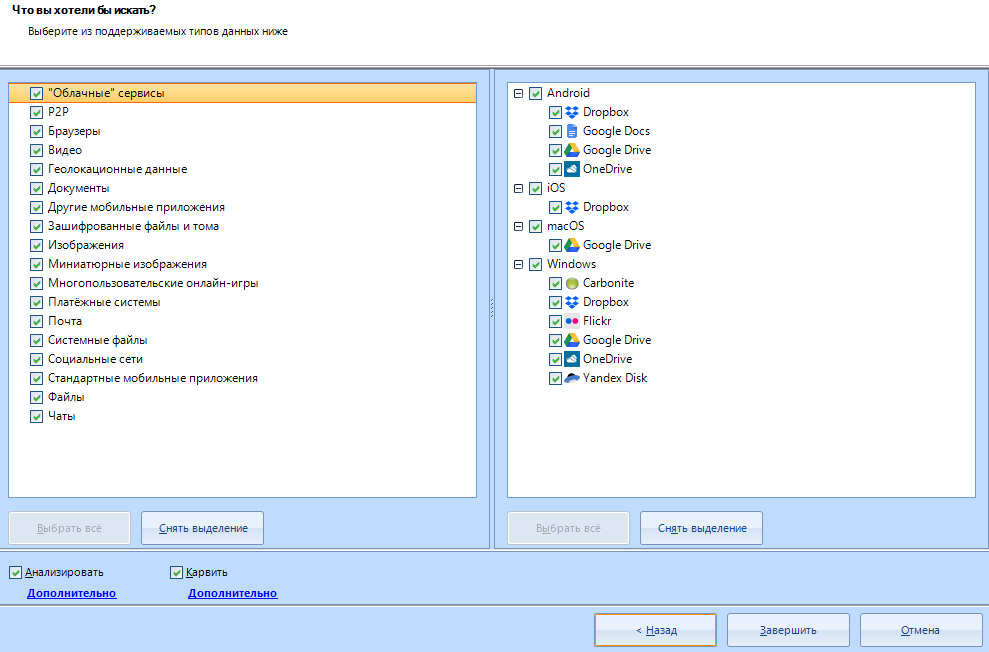
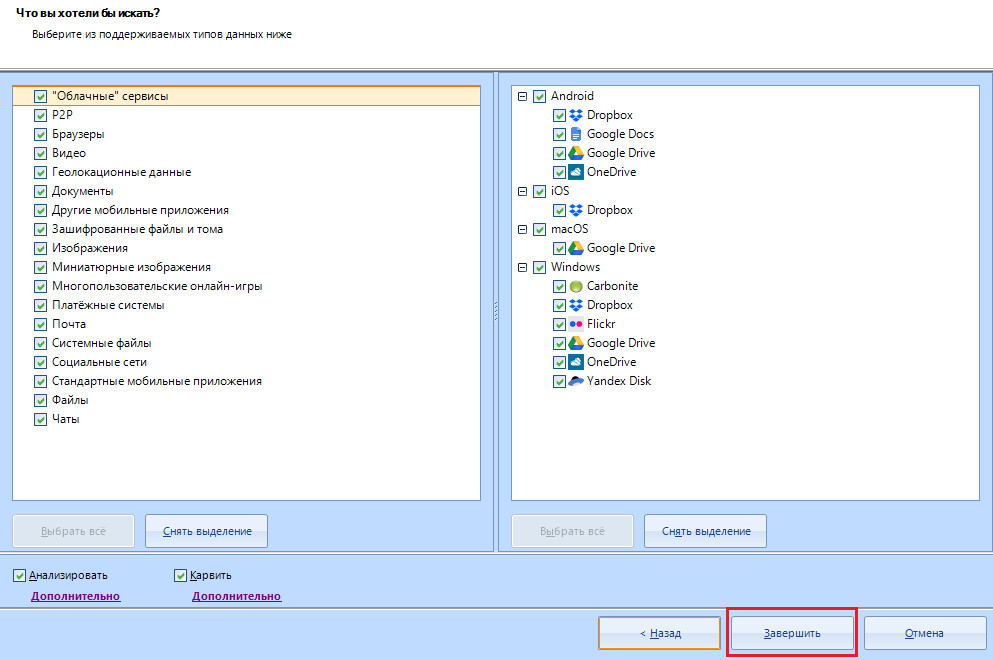
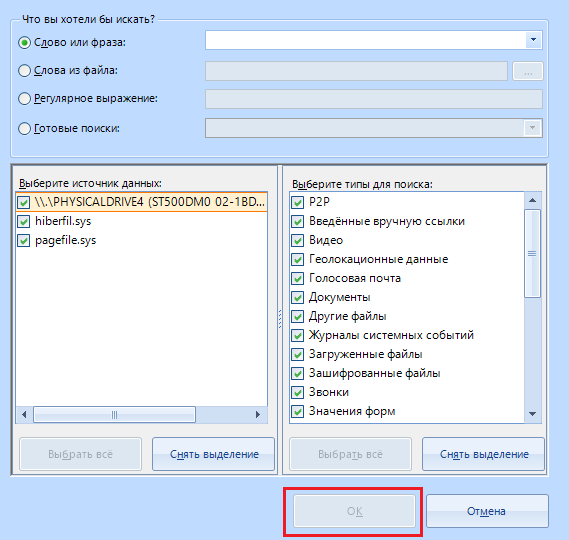
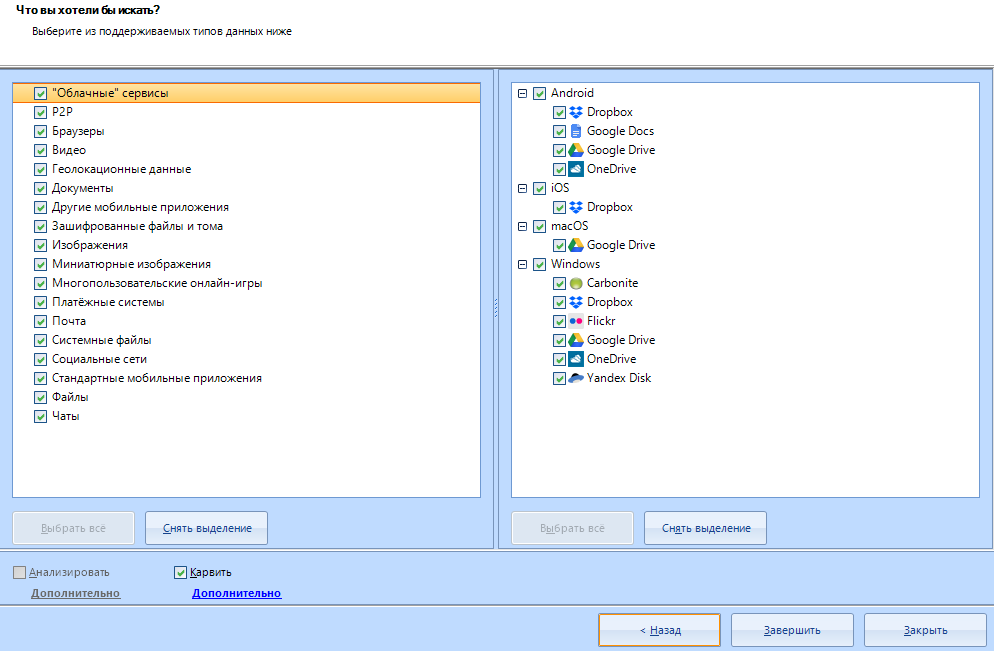
The window for setting the data types for search opens.
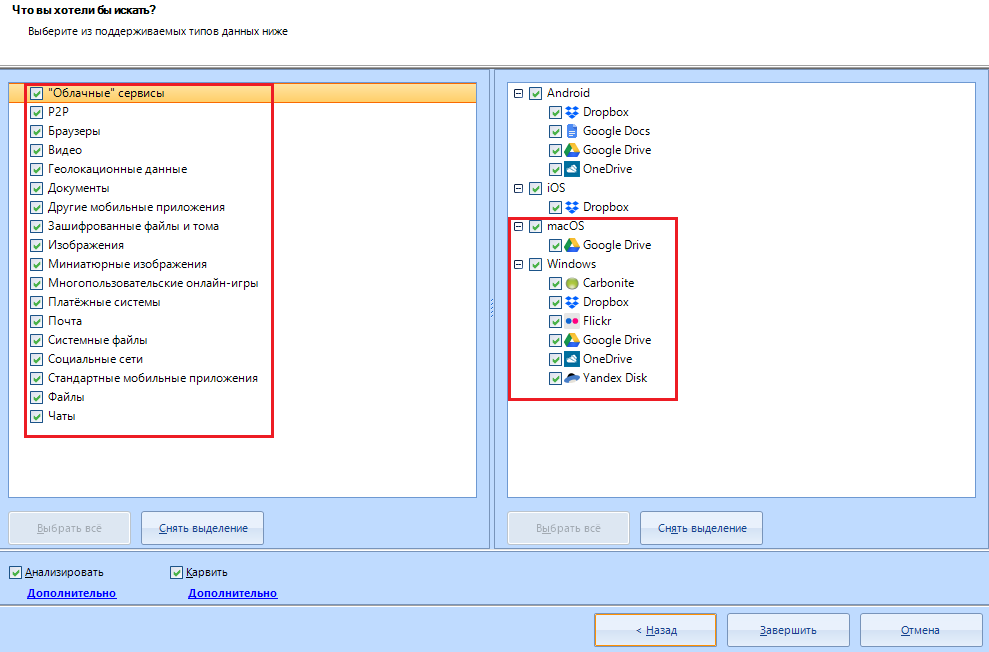
I advise you to always select only these items, but you can leave all items activated (as they are)
I will not explain what is what. I don’t think you have forgotten what “videos” or “Files” are.
Let's take a closer look at the scan and carving settings for the selected disk:
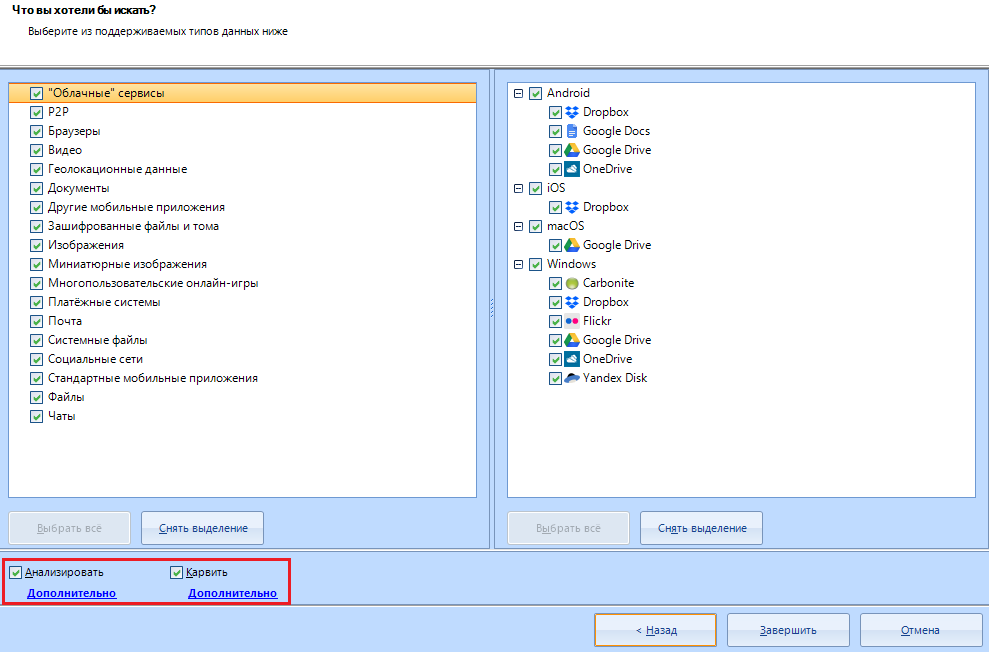
Let 's analyze the "Analyze" setting . To do this, click on the line "additional"
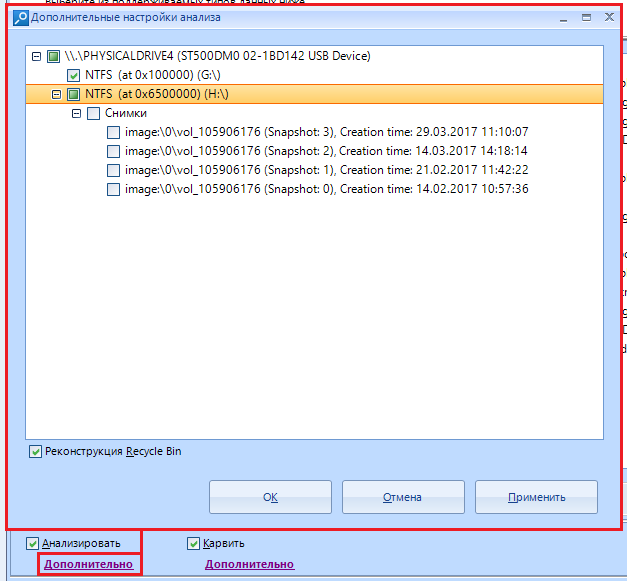
The analysis will go through the file system of the data source, scanning each logical drive, folder (including system, hidden and special), while looking for data of interest within each existing file. This type of analysis is quite fast, but it has limitations.
In this window, you can select the sections of interest to us. This is especially useful when working with dumps of mobile phones, because you can find a whole bunch of such sections there, but only a couple of such sections will contain important data. In addition, the "Recycle Bin Reconstruction" option will help you find files deleted using the Recycle Bin.
By the way, snapshots are not analyzed by default, since their analysis is an extremely time consuming process and this is not always justified by the result.
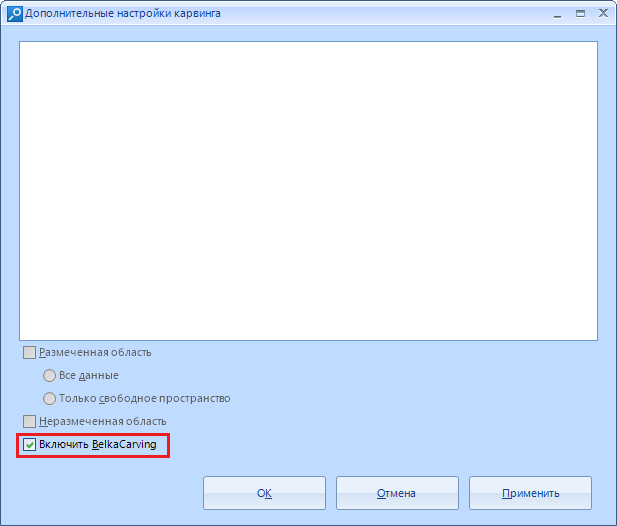
Now let's consider setting up the carving of the selected data source. The setting opens in the same way - by pressing the line "Advanced" under the item "Carve"
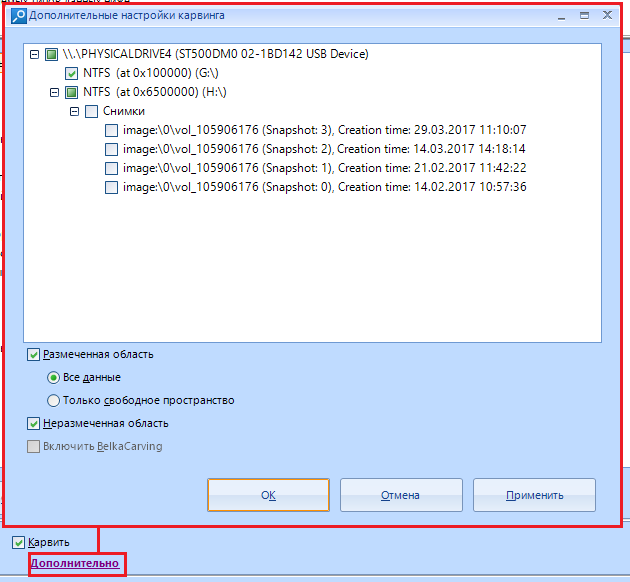
This window offers us a little more options than the scan settings window.
Here we can choose carving for marked, unmarked, or both . We can also choose whether to carve all the data, or "only free space".
Carving "the marked area" identifies the renamed files, the data is in an inactive space and a bunch of other buns. True, this is very time consuming.
Item "Enable BelkaCarving" is only available for memory dump and uses their proprietary BelkaCarving technology, which allows you to defragment the contents of RAM. Great for carving RAM to databases. In addition, the processes will be extracted and presented in a file system window, which we will examine a little later.
Click on “complete” .
When asked about adding an additional data source, we answer negatively (or positively, if you scan multiple sources):
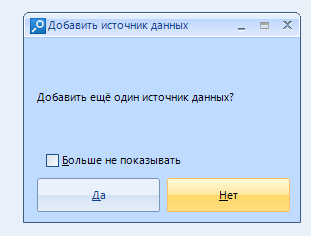 Here is the most malicious message. Feel free to click on "no"
After this message, the Evidence Center starts its work. If you have configured the consumption of computer resources, you can study the program while it is running.
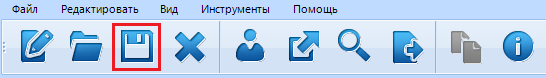
Before we start exploring the main menus, we will examine the header and all its functions.
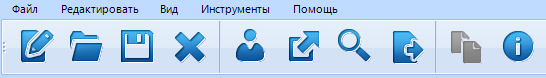
"File"
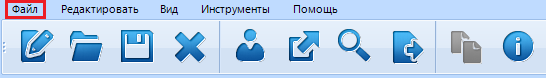
It combines several functions: opening another business, creating a new one, exit.
There are hotkeys (hotkeys):
Alt + F4 - Exit the application
Ctrl + O - Open another case
"Edit"
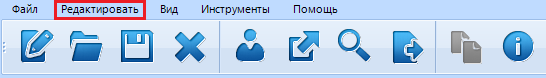
It includes editing the found data: Analysis, deletion, adding a new data source, searching by results, creating a report.
Hotkeys:
Ctrl + Shift + F - Add data source
Ctrl + F - Search
"View"
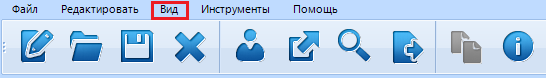
Changing the graphical interface. Adding new windows for working with data (let's look at everything), changing the theme, rolling back to the default view (restarting the program is required).
For some reason, the developers have built in hotkeys and here:
Ctrl + Shift + Alt + T - change the application theme.
In general, there are 9 themes of the application, and all of them (except two) look terrible. It is unclear why it was added at all.
"Tools"
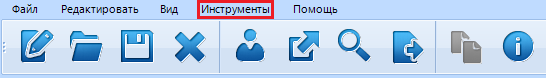
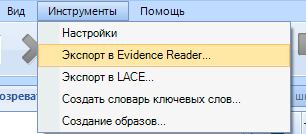
Basic tools for working with scanning. Customization, export to Evidence Reader (we will consider it) and LACE , Creation of a dictionary of keywords for search, creation of images.
There are no hotkeys and their combinations.
"Help"
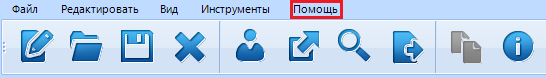
Local help for the program, License information, Search for updates (I do not advise you to poke here), Product information.
No hotkeys
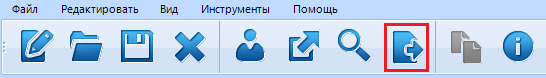
Go to the quick access panel.
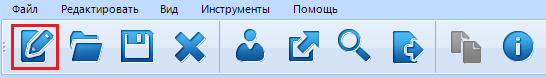
This icon is the creation of a new case. Like a button in the "Main" menu, but duplicated in the panel
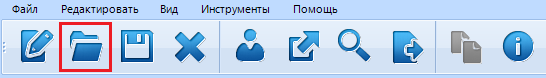
Opening an existing case on a carrier.
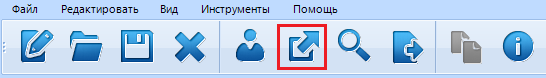
Export to Evidence Reader
This function requires completion of all active media scanning processes, so it is best to do this at the end of the scan.
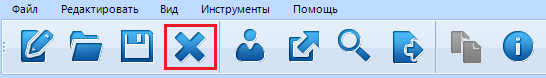
Deleting a profile, only works with optional data. For example, you can delete junk profiles in the case explorer (we'll get to know that later) to make the report a little cleaner.
Adding a new data source to the case. I remind you about the key combination the Ctrl + the Shift + the F.
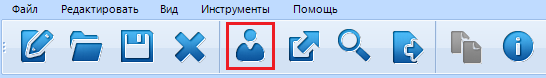
analysis of the selected profile or data.
Search for data on a report / case.
When you click on it (or the key combination Ctrl + F), a window pops up:

Here we choose what type of data to search for: Word , with lovo from a specific file , Regular expression, or a choice of already preset search settings. The list of “ready-made searches” includes the following items:
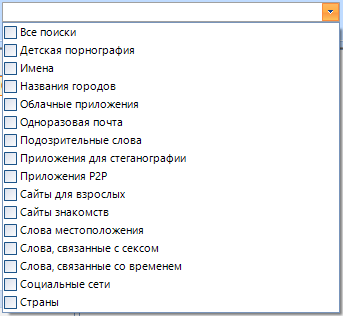
I don’t think that these settings will be useful to you in everyday life. They are designed to search for prohibited materials and are mainly used by the special services.
But if you want, you can think of something like “Find CP on your PC challenge”
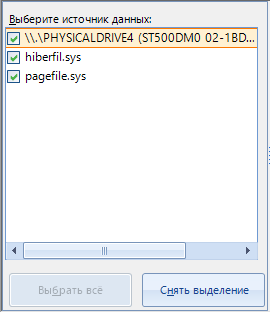
In the left menu, we select the data source that will be searched for. You can select several at once:
And in the types for search, we select the data by which the search will be performed:
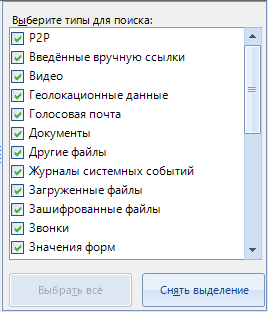
Upon completion of the configuration, click on the "OK" button and a new search task is added to the program's work, which will scan files for the presence of specified data in the course of the main work.
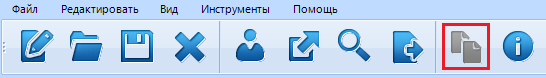
That's it, the next item is "Create a report"
With this function, you can create a report for the selected area. For example, a report on browser cache, running tasks or scheduled tasks.
The window for creating a report looks like this:
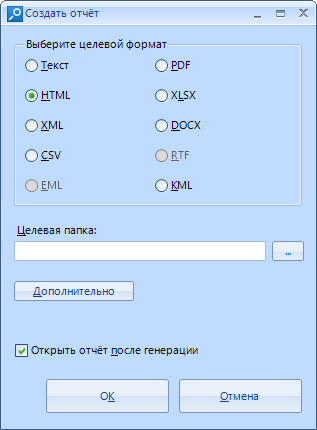
The report can be created in one of 10 formats.
By clicking on the "advanced" button, we will customize the report on three main points: Formatting, style and grouping.
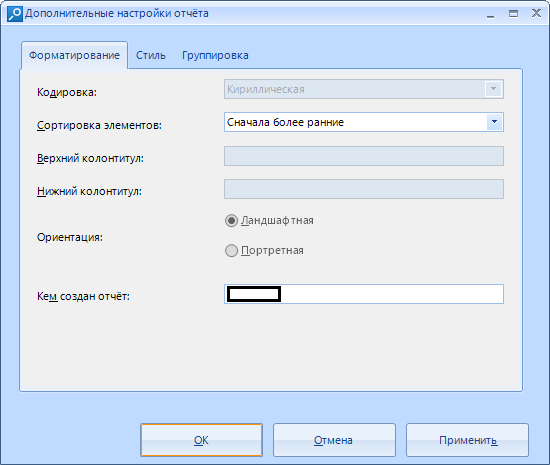
In formatting, we can choose the encoding (not always), sort the items (By early or late, no sorting or custom), set the header and footer (none), select the orientation (by default, it is landscape), and enter the name of the person by whom the report was created.
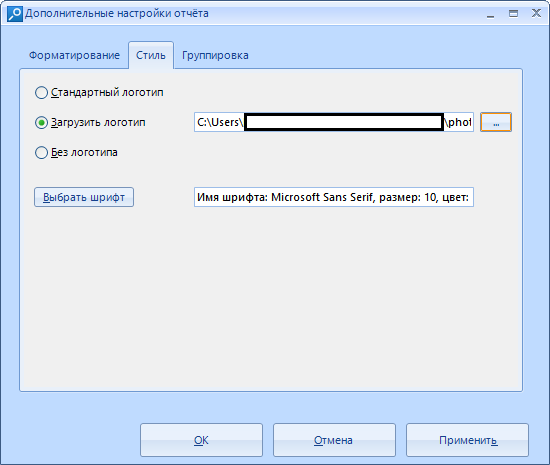
In the style, we set the logo. You can set your own, or you can use the standard one . In addition, it is possible to choose the font that is optimal for us, its size and color (report drawn up by Сomic Sans mmm oaoa).
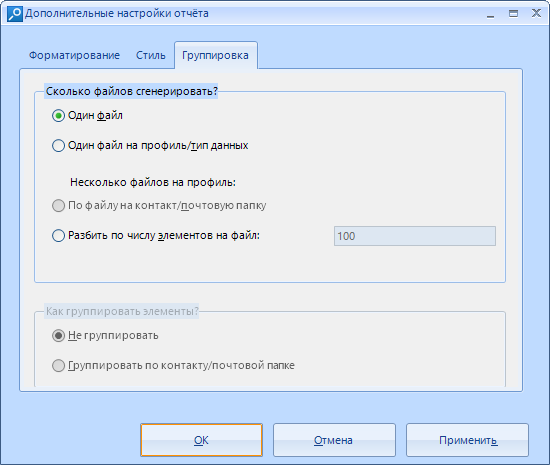
In the grouping, we customize the generated file. We can split it into several files, but according to the standard, reports are generated in one file. In addition, you can group items. They are not grouped by default.
After setting, we can click on the “Apply” button (I will not highlight it) if you have configured or “Cancel” (I will not highlight this button either) if you just came in to look or feel that you messed up.
The report itself looks like this:
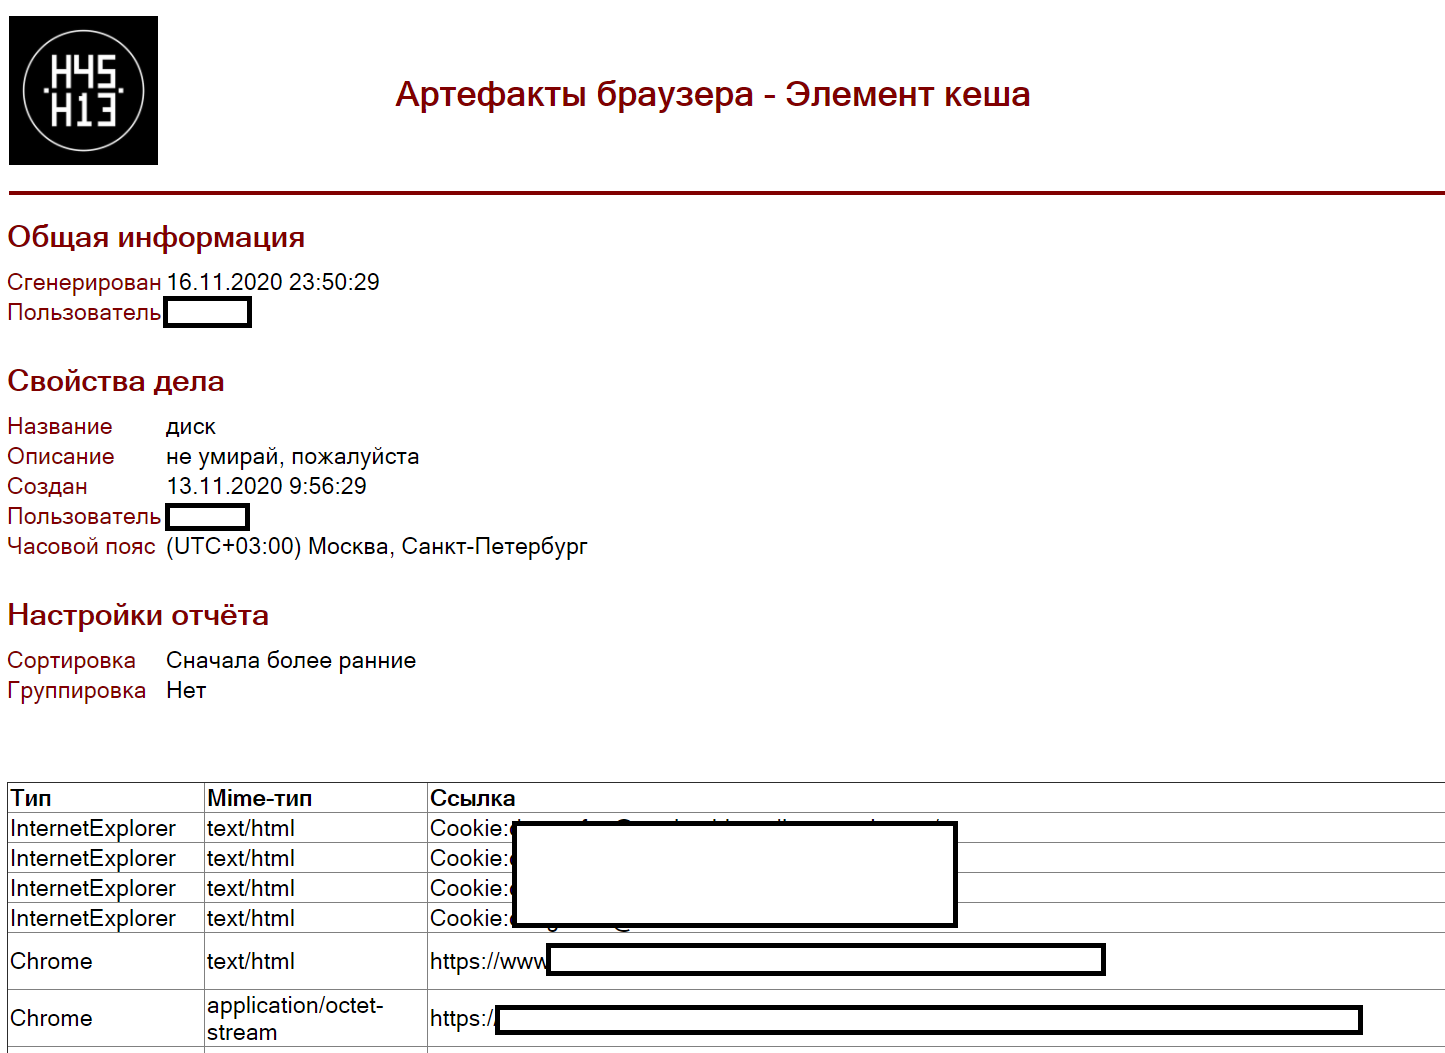
With the report everything, let's move on.
But I don’t know what it is. True, I even read the help twice.
"Help"
Opens local help. Caution English!
If you have any questions about this or that item, but I did not consider them in this article, please contact
With this sorted out. It remains to deal with the windows
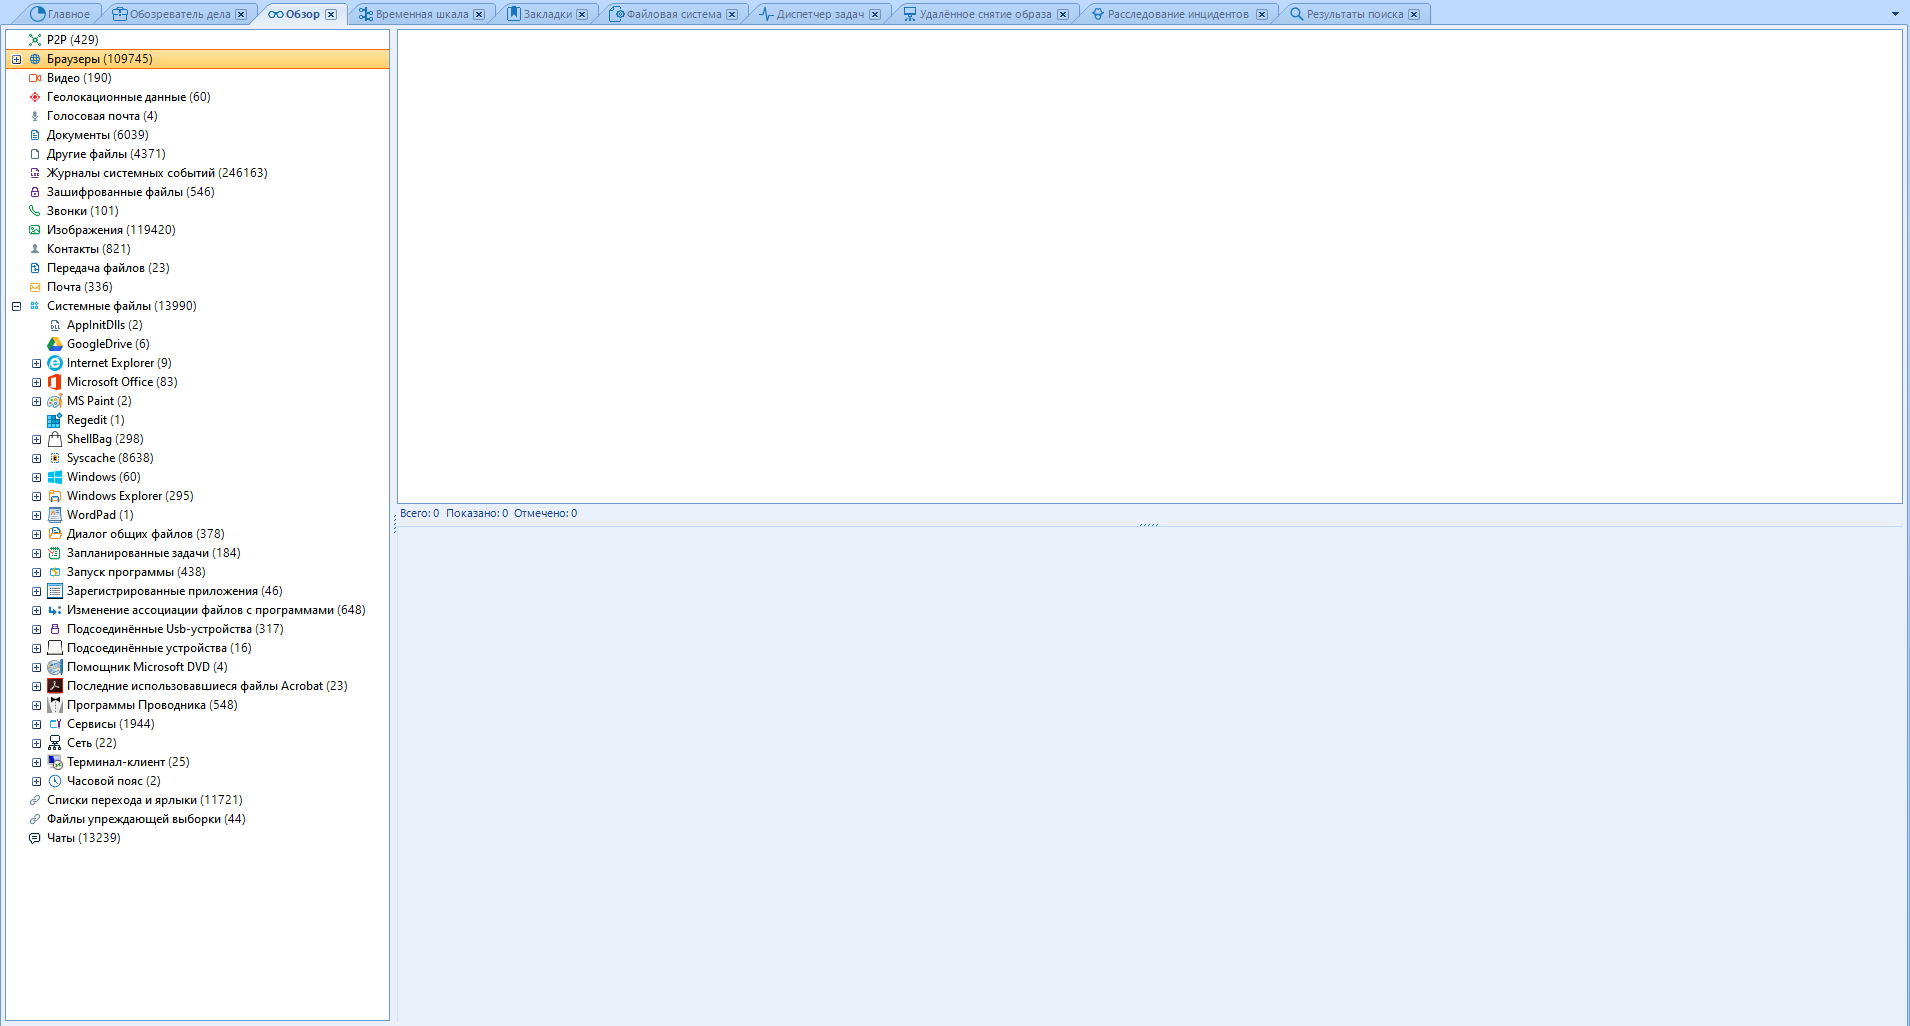
We'll start with the "Main" window / tab.
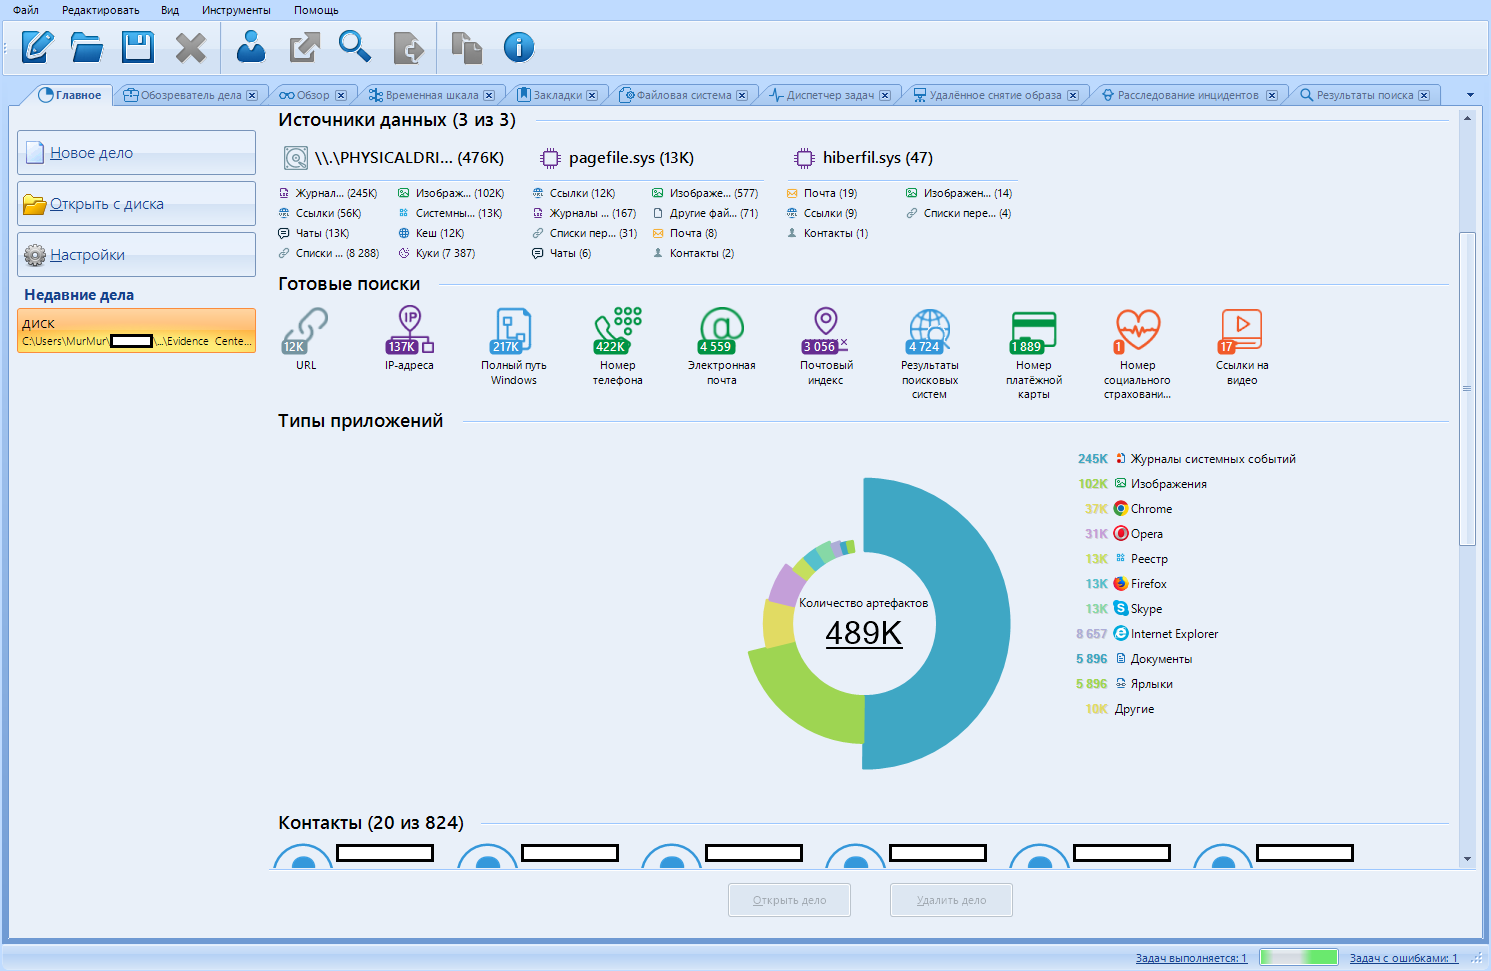
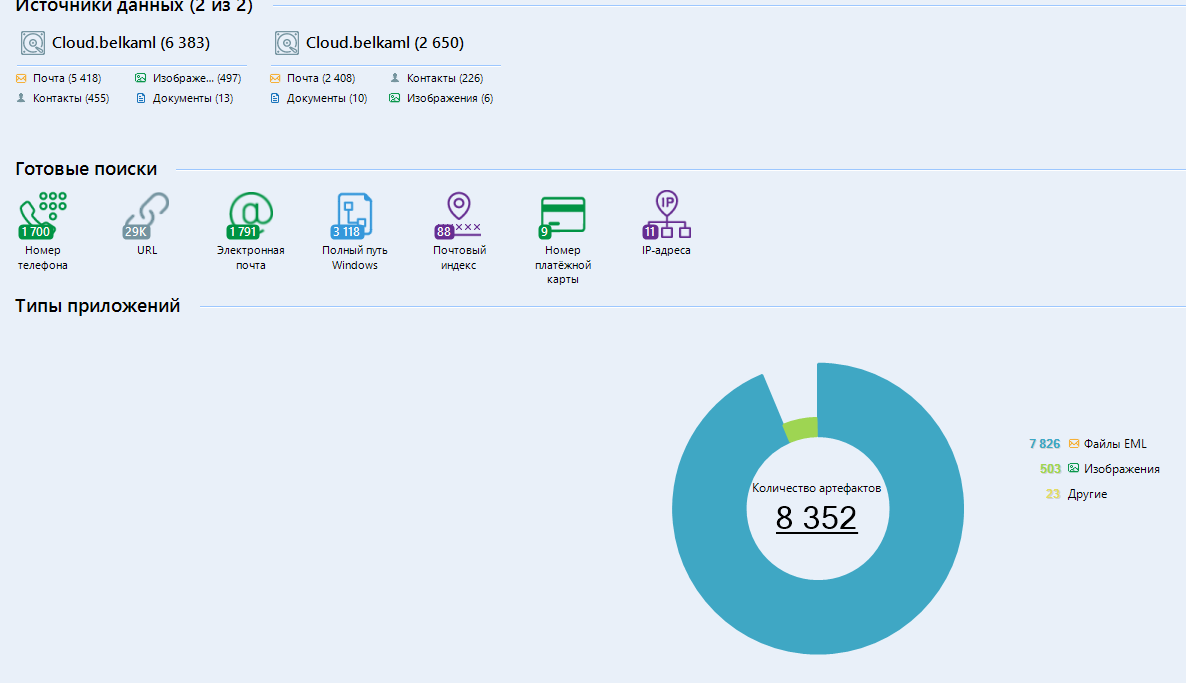
In the “Recent cases” sub-item, as I predicted, our new case appears. By clicking on it, we can see a brief summary of the data found. The infographics we deserve.
Now let's take each element in order.
Case data
Basic data: title, case folder, creation date, description, and so on.
Data sources
List of found data sources, information about the number of main files found (image, chats, cookies, links, etc.)
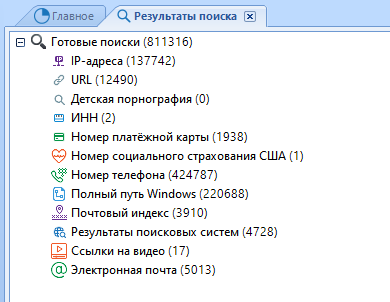
Ready searches
Evidence Center, in addition to normal data recovery, performs a “quick search” on them. If you click on one of the icons, you will be redirected to the “Search Results” tab
Application types
Interactive pie chart. Evidence found statistics
Contacts
A short list of active contacts. Or rather, their top.
Artifacts
Pie chart of found artifacts. When compiling it, only the most numerous artifacts were taken into account.
Reports (?From?)
List of reports on this case. Appears only when such are created.
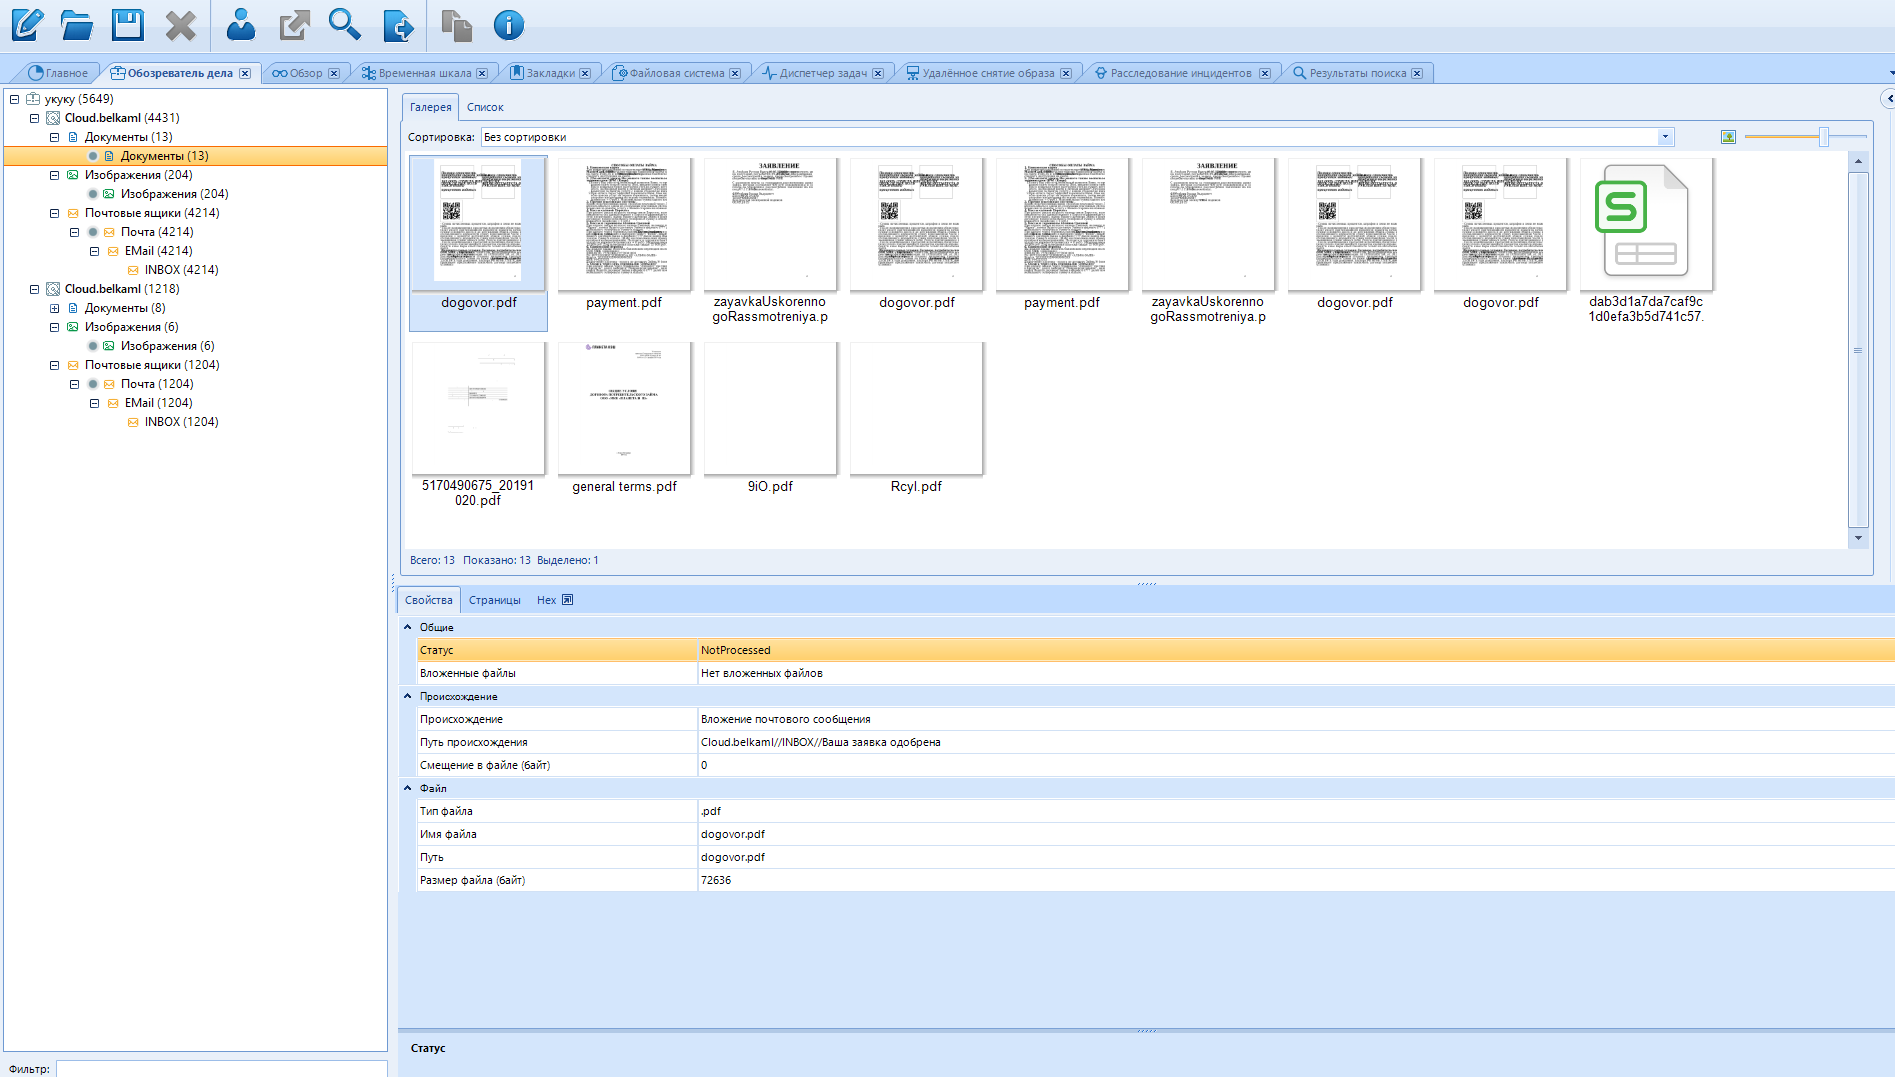
Go to the "Case Observer".
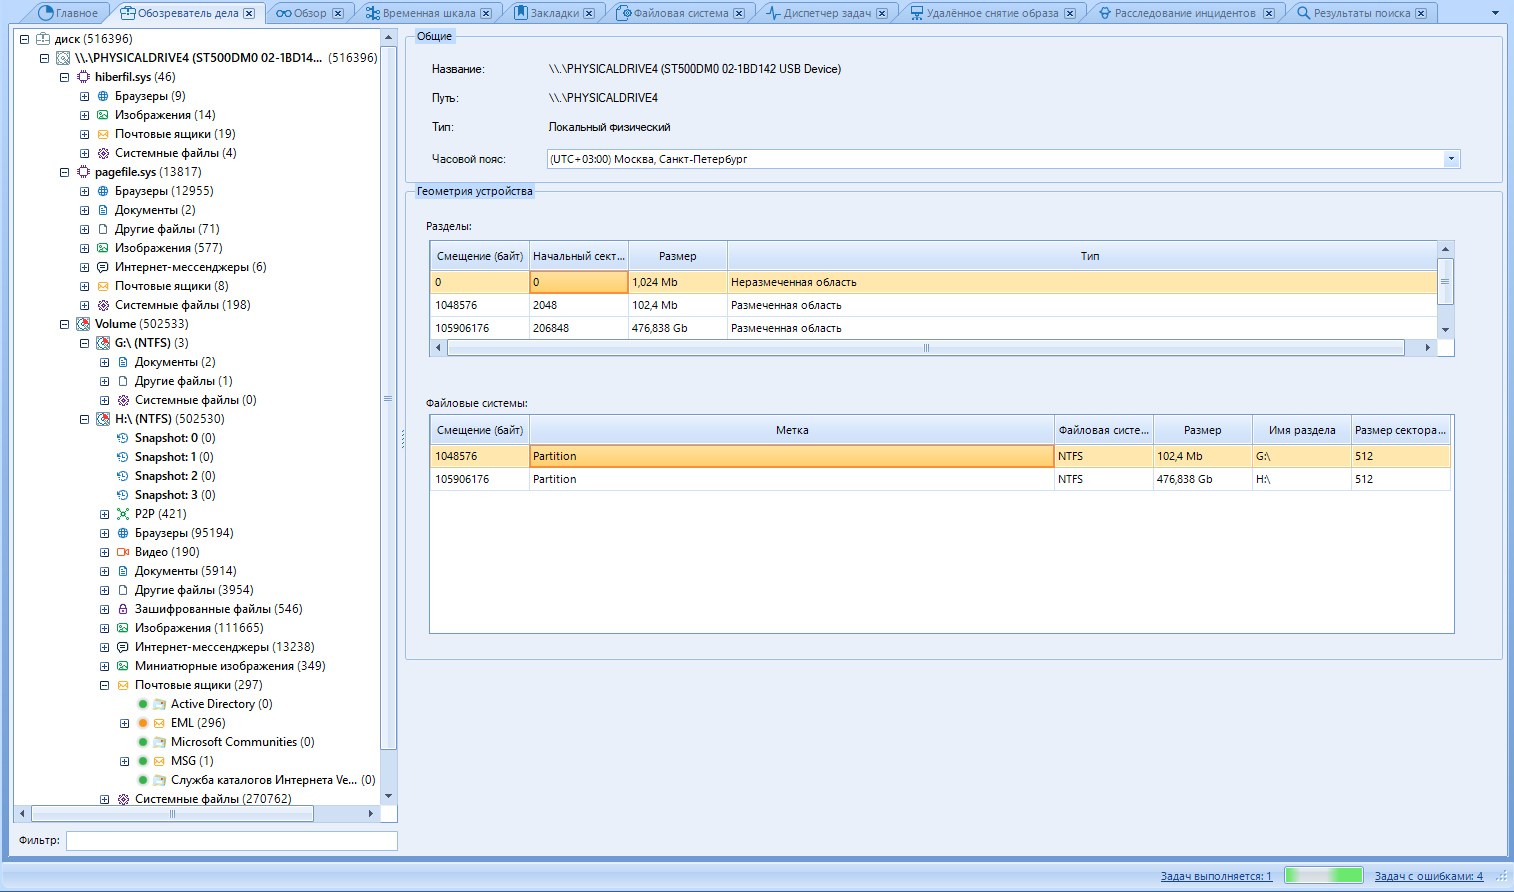
Case Browser shows the same information as Browse, but breaks all artifacts into data sources, artifact type, and profile.
Like other tabs, we can split this window into two areas.
Left - Artifact tree.
The right one is the work area.
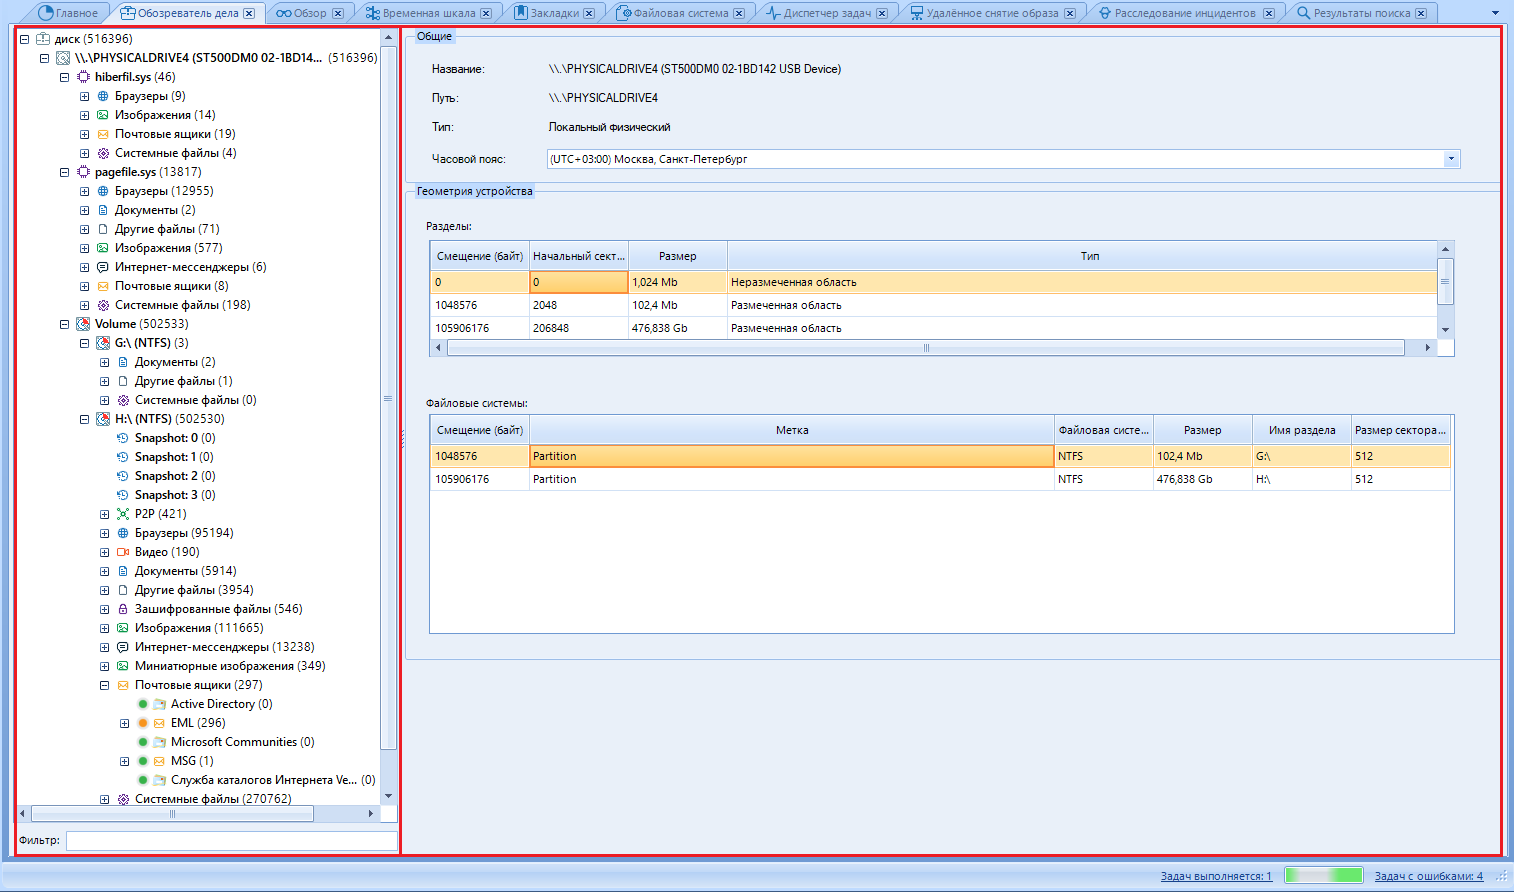
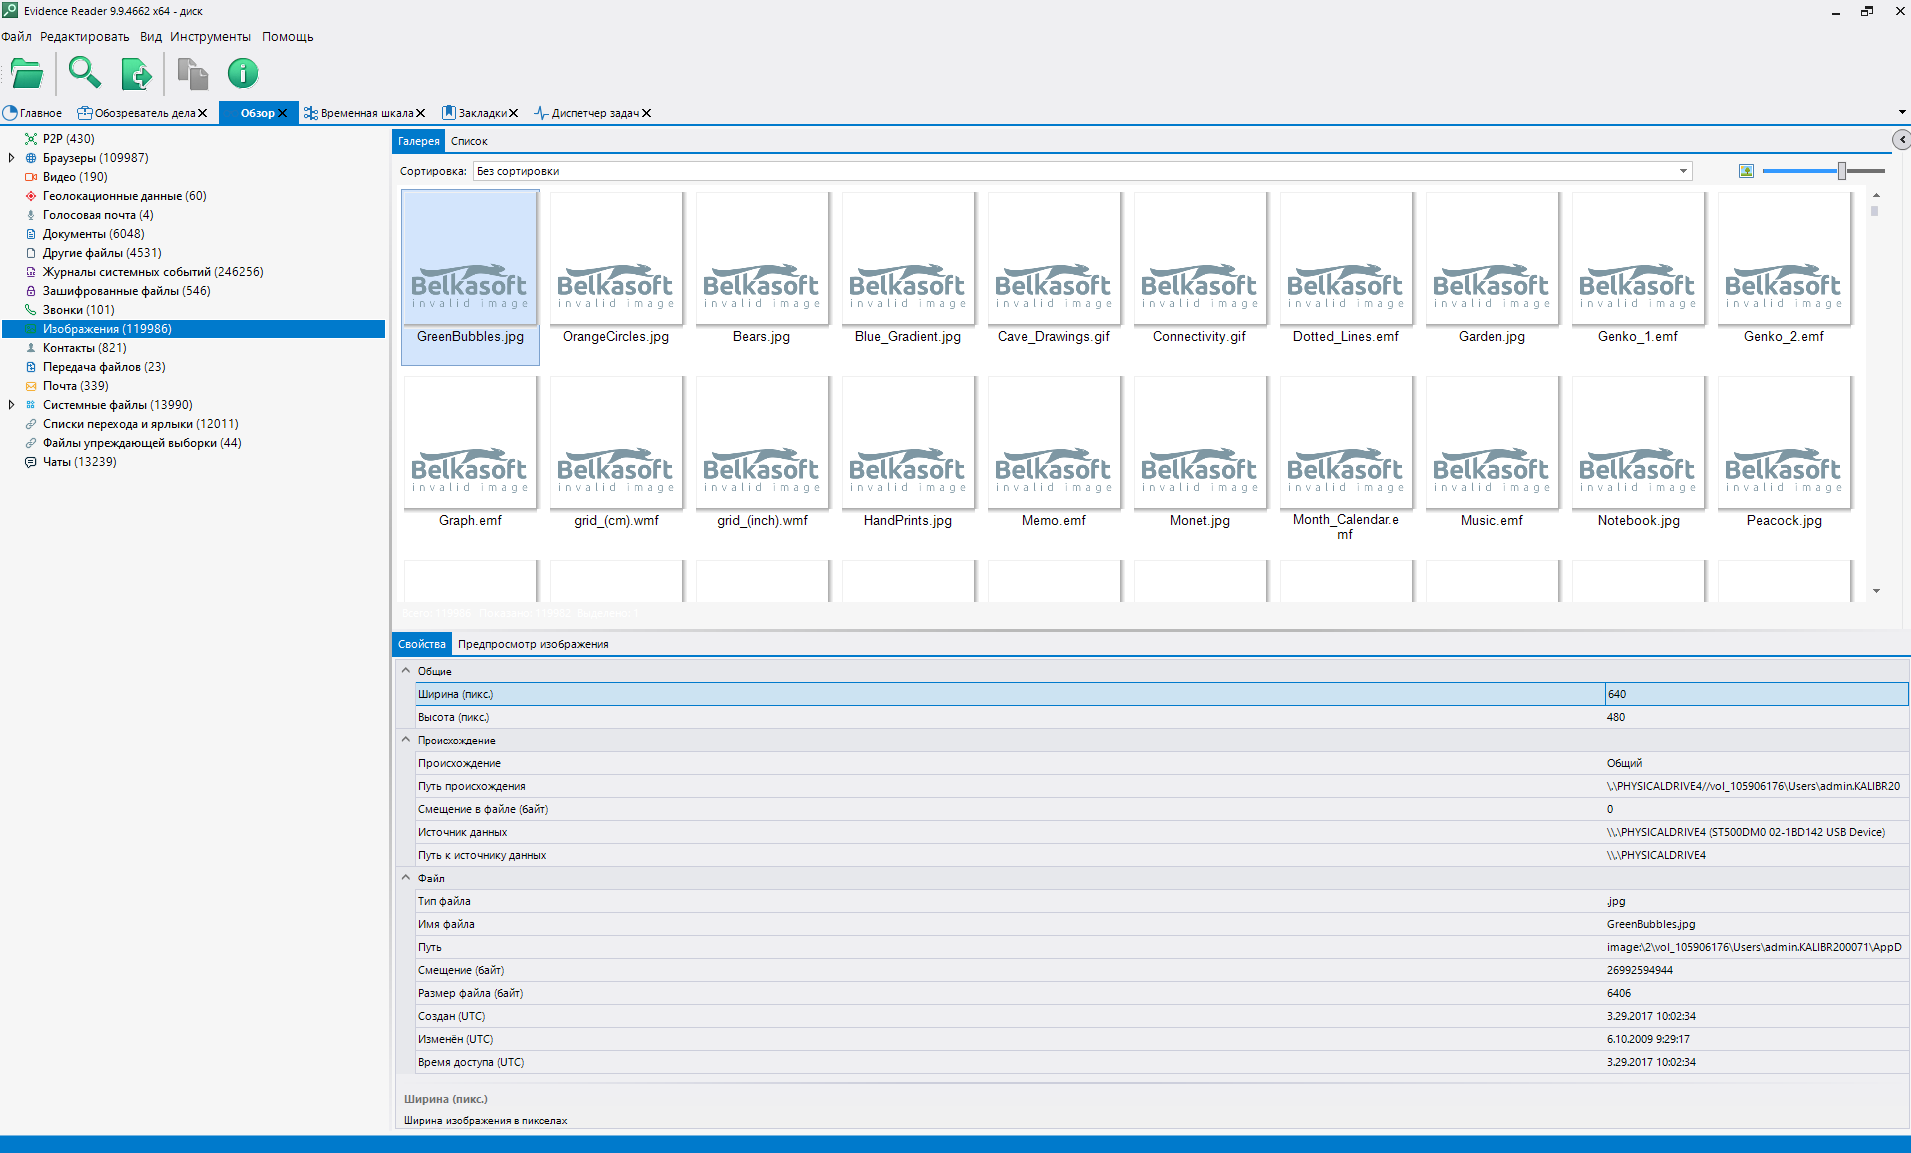
In the tree, we select the data we are interested in. In the working part, we read this very data and work with it. We will work with pictures. I think they are most suitable for the example of working with files.
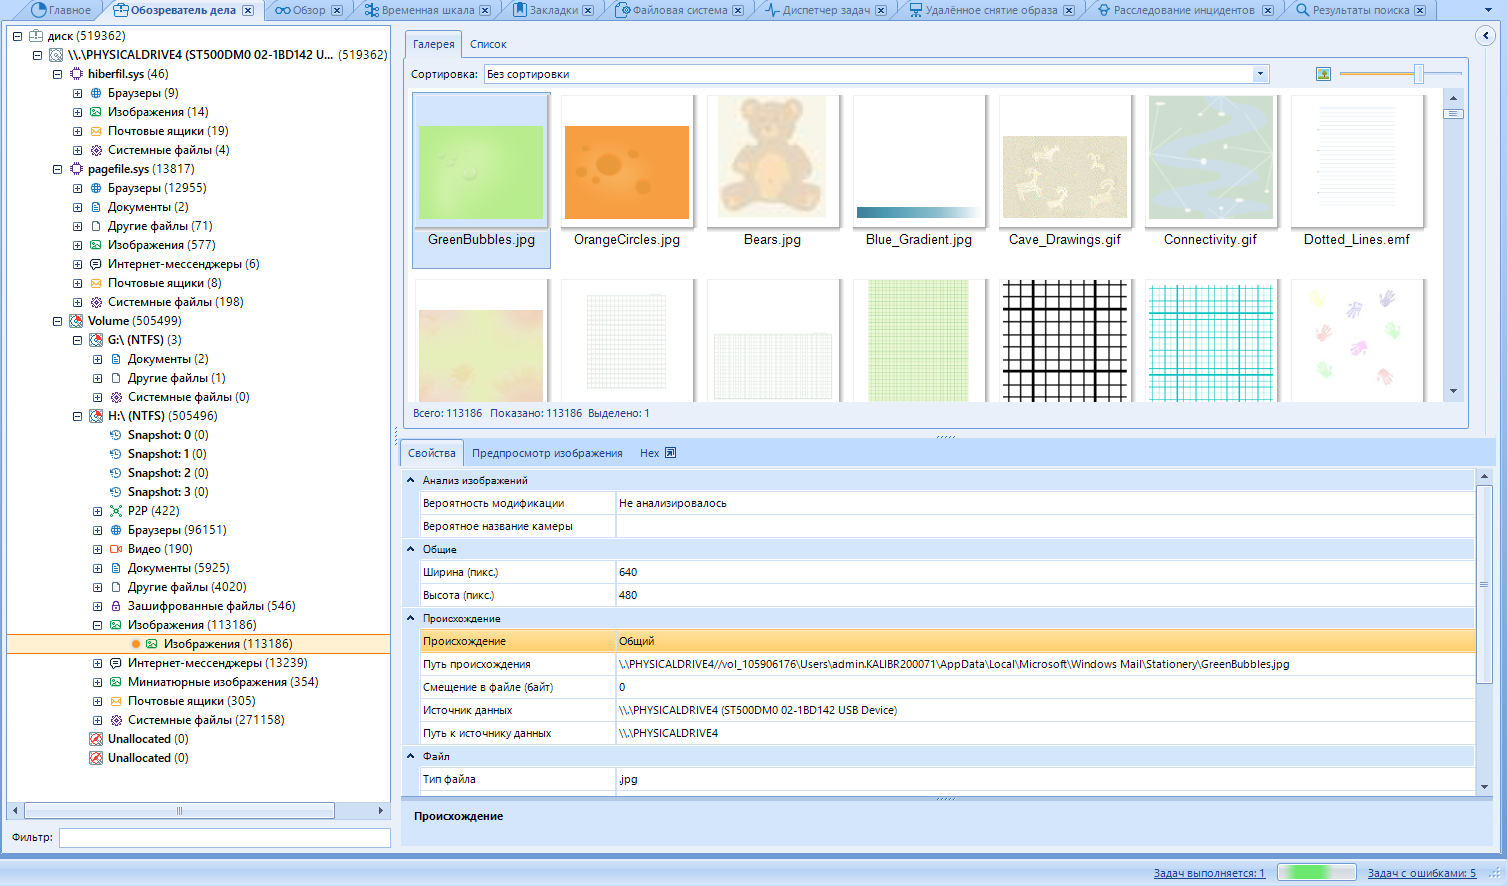
We select the area of interest to us and the file.
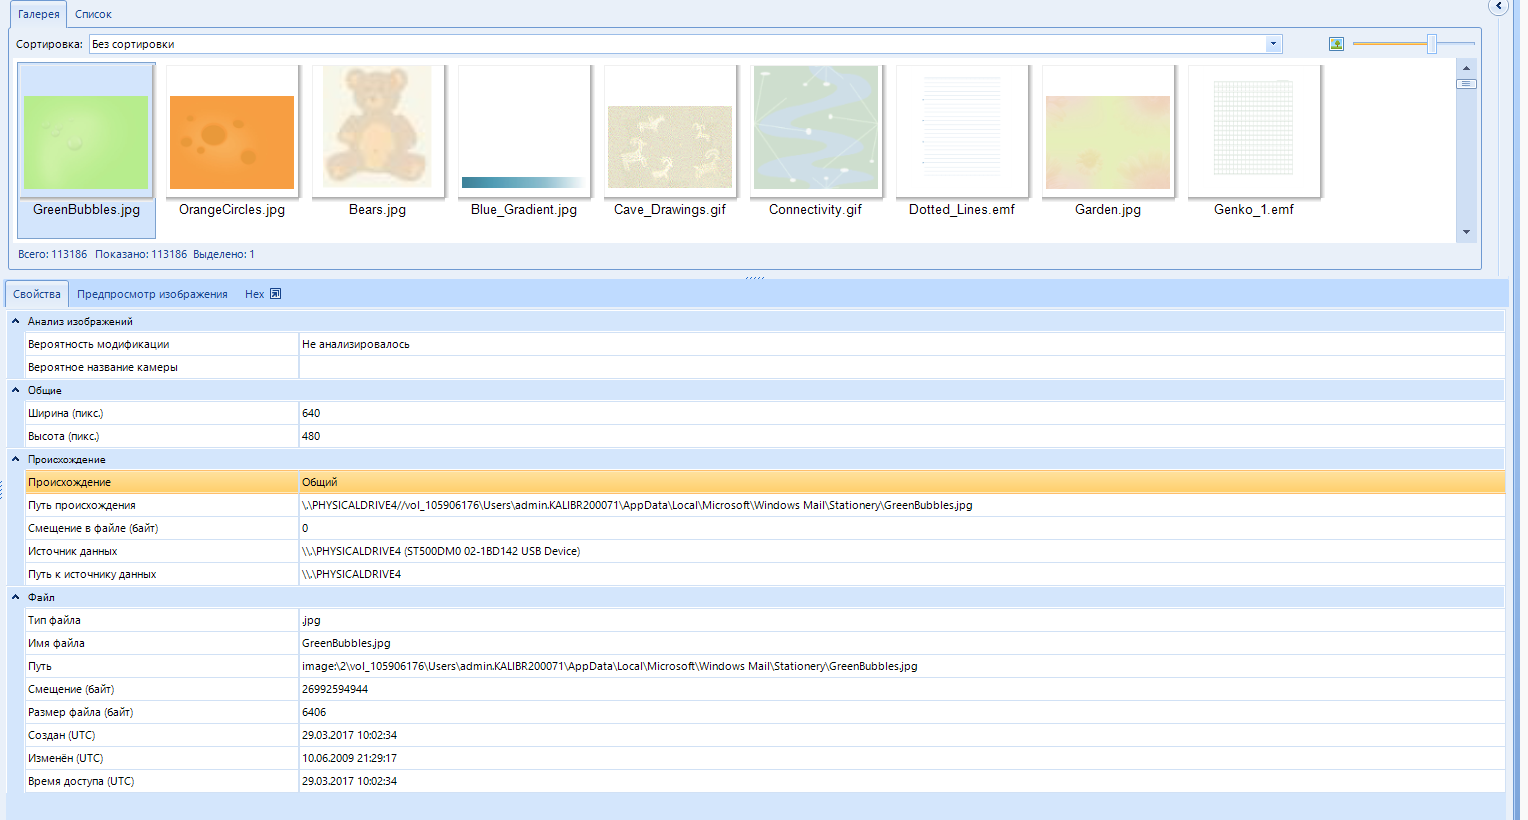
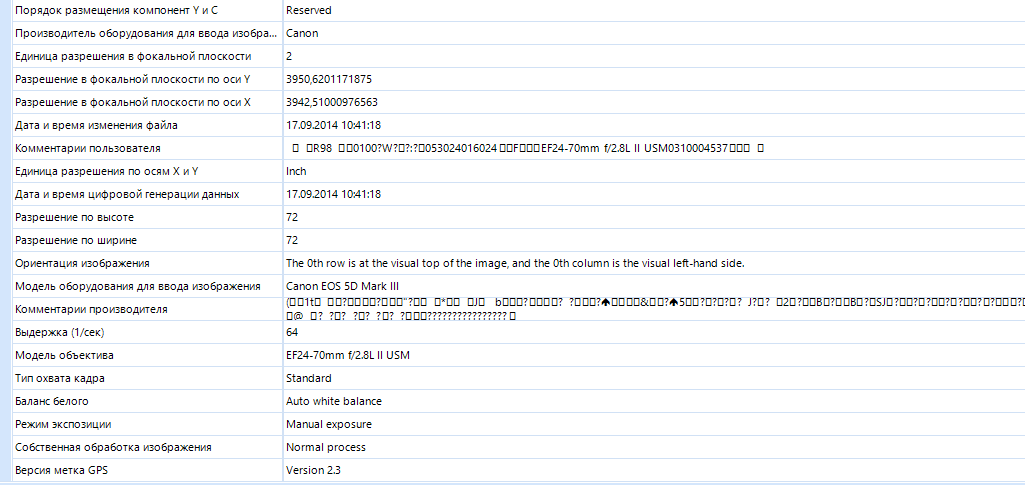
In the properties, you can find the file metadata. for example, if the photo was taken with a phone, the geolocation data of where the photo was taken may be displayed. The camera settings that were exposed when creating the photo will also be available:
In addition, there is a preview of the image. The function displays the image to the system application for viewing photos, and not in a separate window, as if we were opening it from the general list of files:
It is very convenient to work with hex in the program:

In the next window, the values are translated into several encodings at once, nothing superfluous. Unless there is no search by hex, but it doesn't matter, because we have a basic search. Although, I must say that the local is also lacking. Especially in Hex.
In addition, there is a filter for found artifacts:
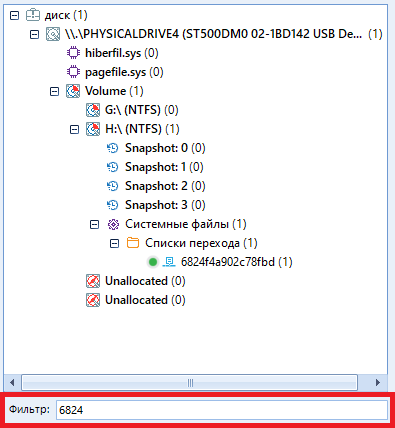
Not to be confused with search.
This concludes the overview of the page, click on the "Overview" tab
Here the situation is more interesting, since the data is sorted, and there are much more of them. The working areas are the same: left and right.
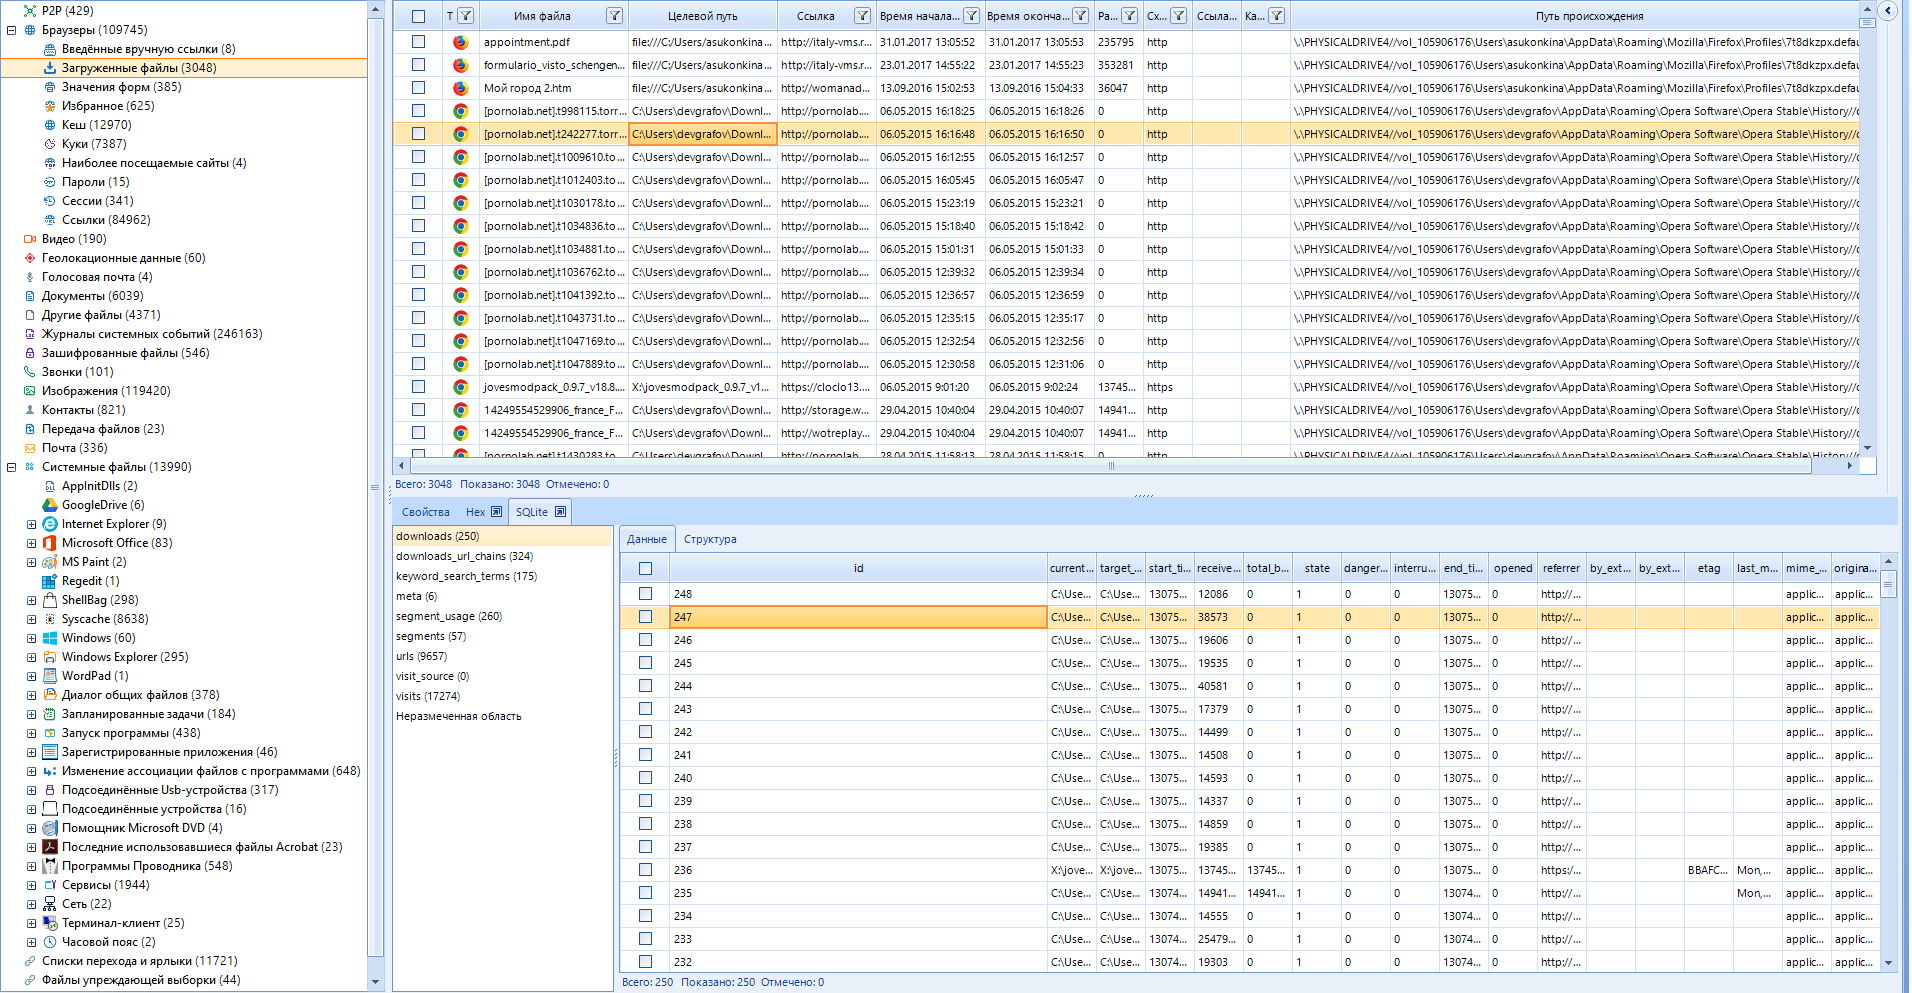
In addition to the main data, SQLite tables are also available to us, which greatly simplifies the search for information.
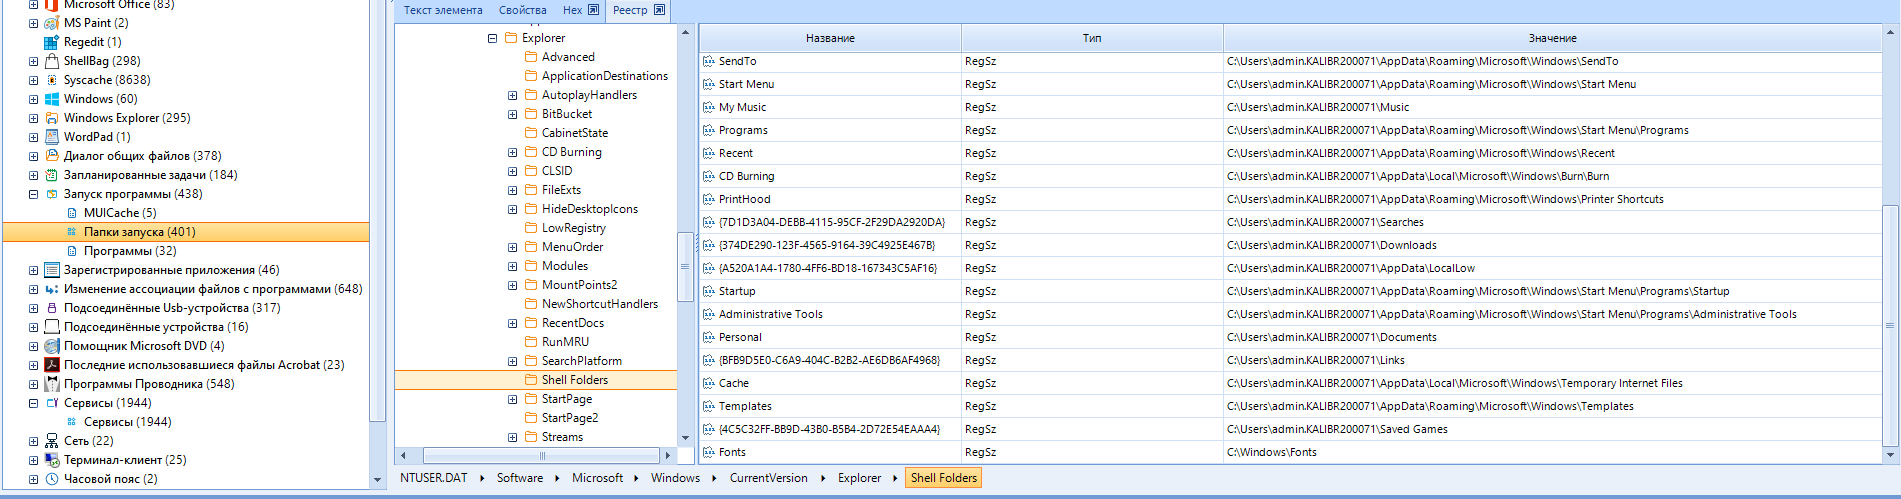
Well, where do you go without viewing the registry. Working with registry data is fine. There is a lot to paint here. And yes, you can view saved chats and passwords here.
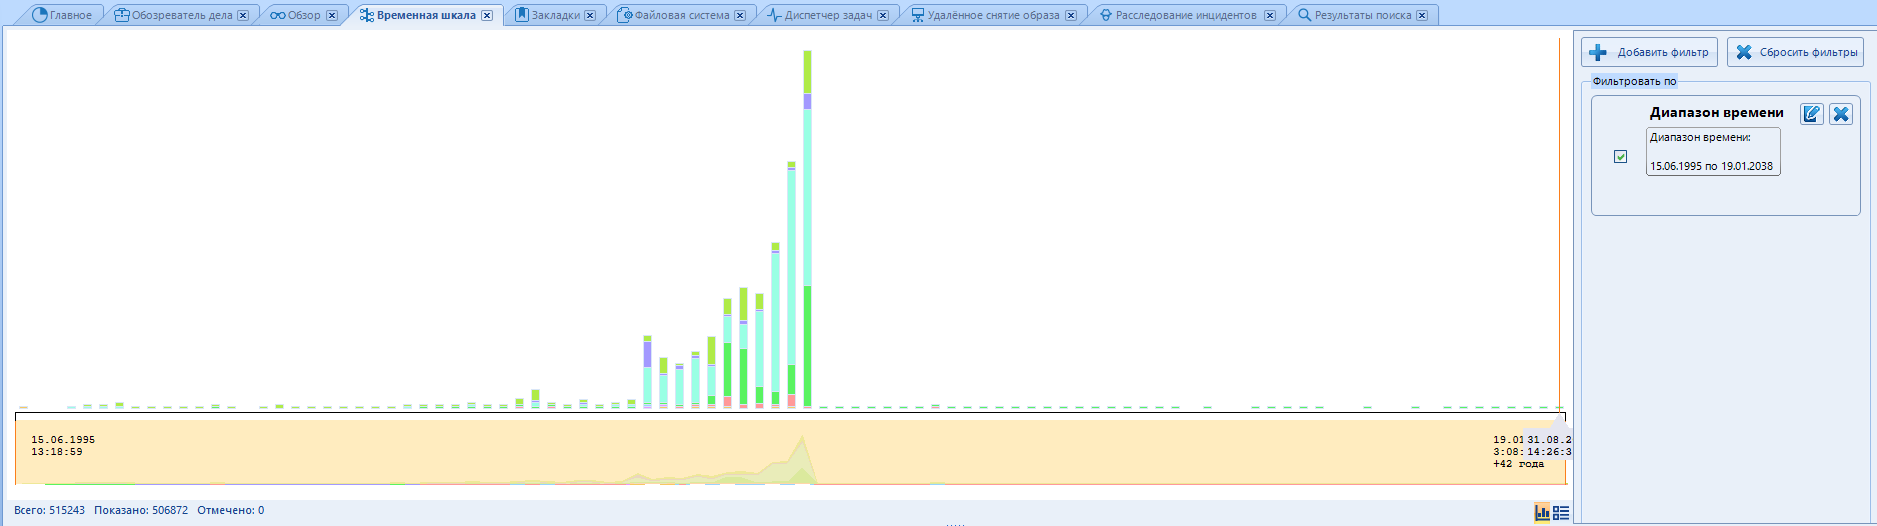
Move on. "Timeline"
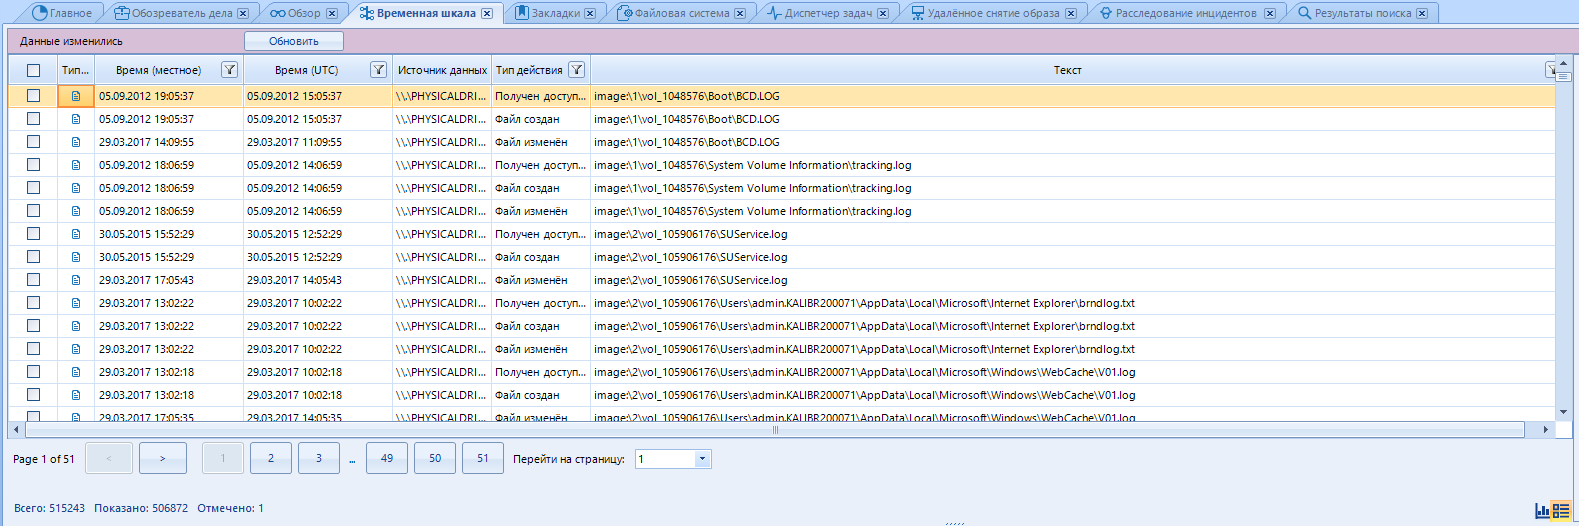
From this data, you can build a graph using the switch

The timeline window brings together all artifacts in the case that are date and time stamped. Whatever it is, it appears in the list of timeline items. Here we can see what happened at a particular time on the device (or several devices). Please note that some artifacts may be listed multiple times in this window. Each artifact has a different operating system run time, for example "Created" or "Last Access Time" (Action type column). In addition, various events can be recorded in artifacts with metadata, for example, GPS time for a snapshot. And each time a separate line will be displayed on the timeline.
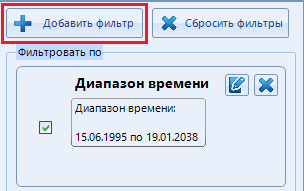
On the right, there is the “Filter by” function. Here you can set the time range for which the data will be checked. To add your range, click here:
A window with filter types opens. There are five of them:
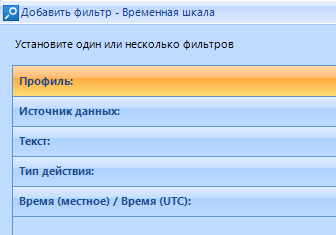
Select the filter we need and click on it. The previously hidden page is expanded:
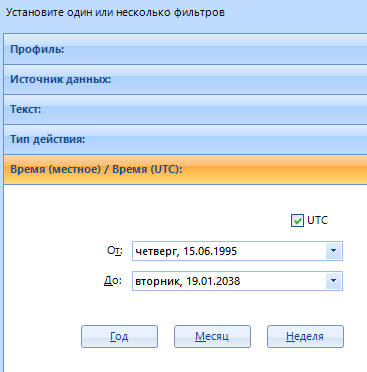
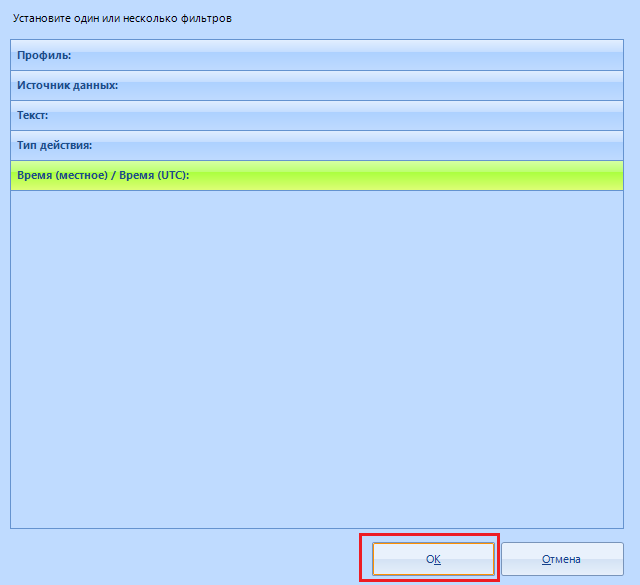
The configured types will be highlighted in green:
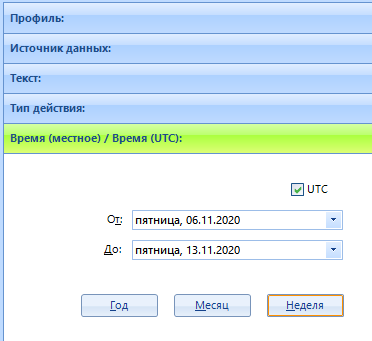
After installing the filter, click on "Ok" in the lower right corner
We finished here. Go to "Bookmarks":
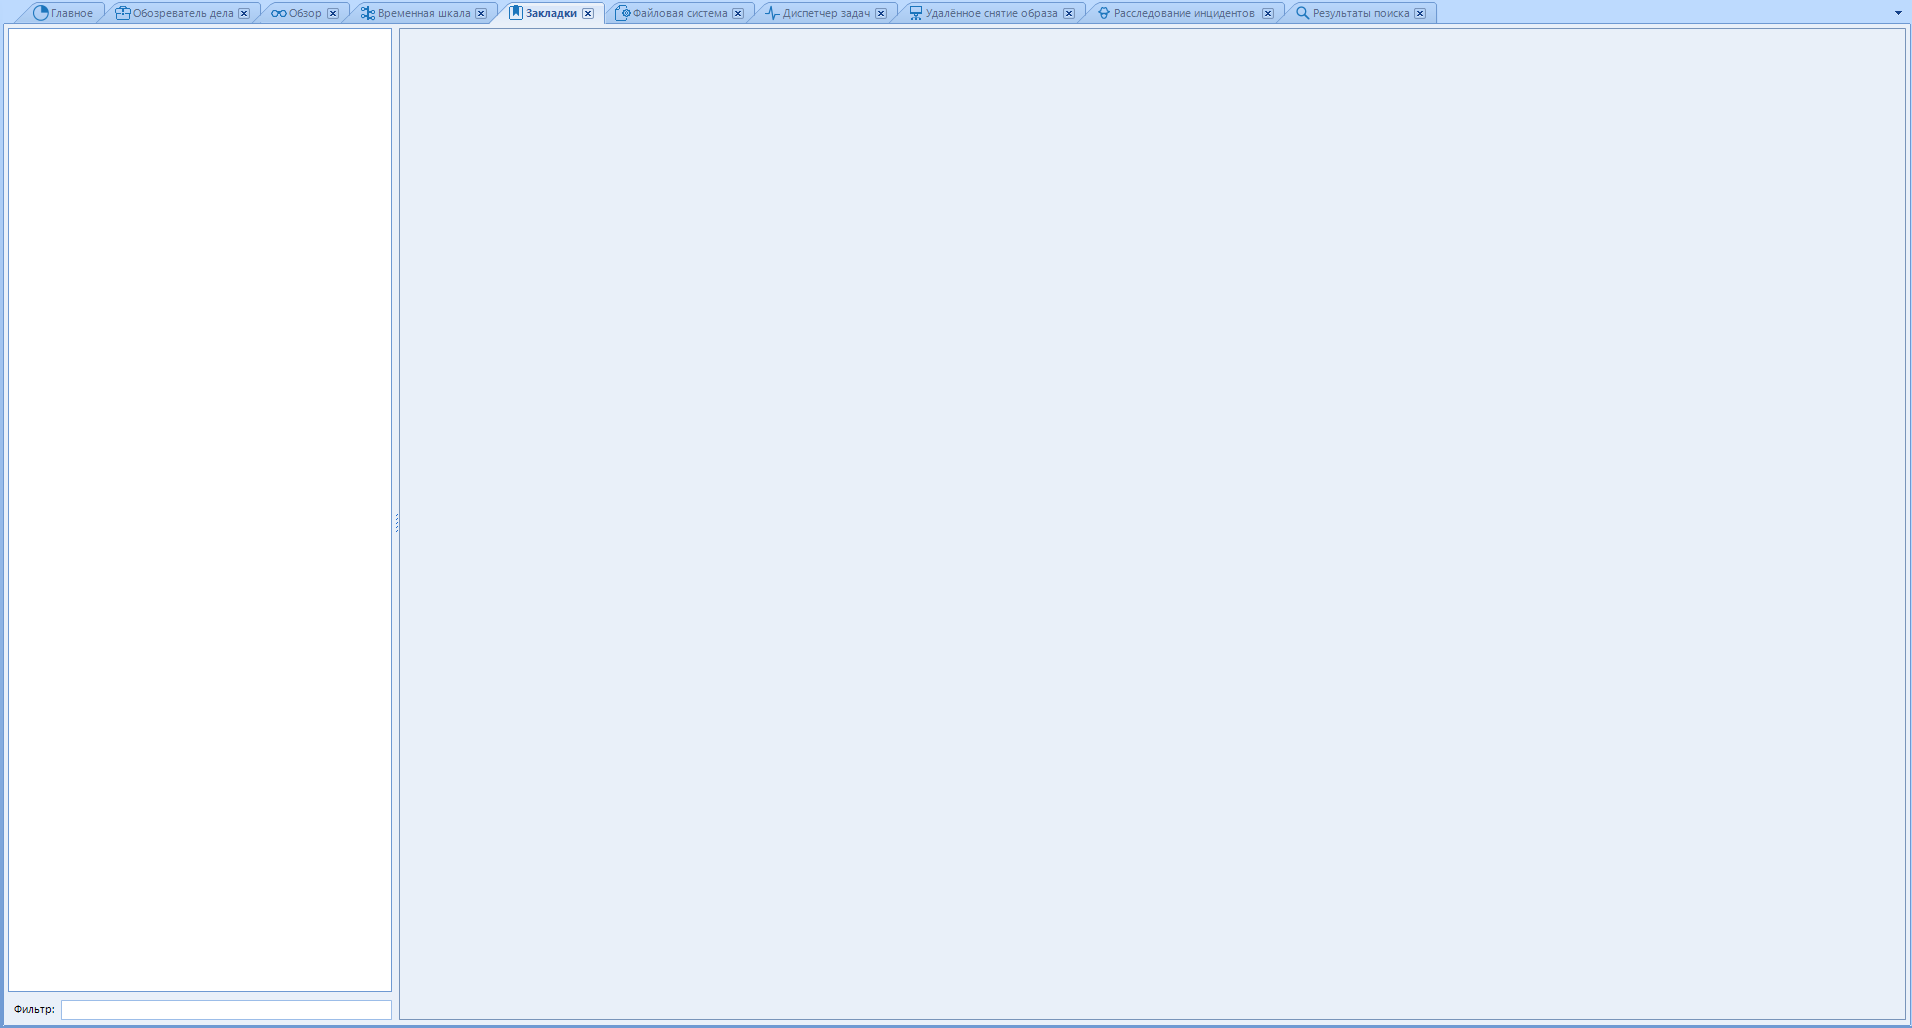
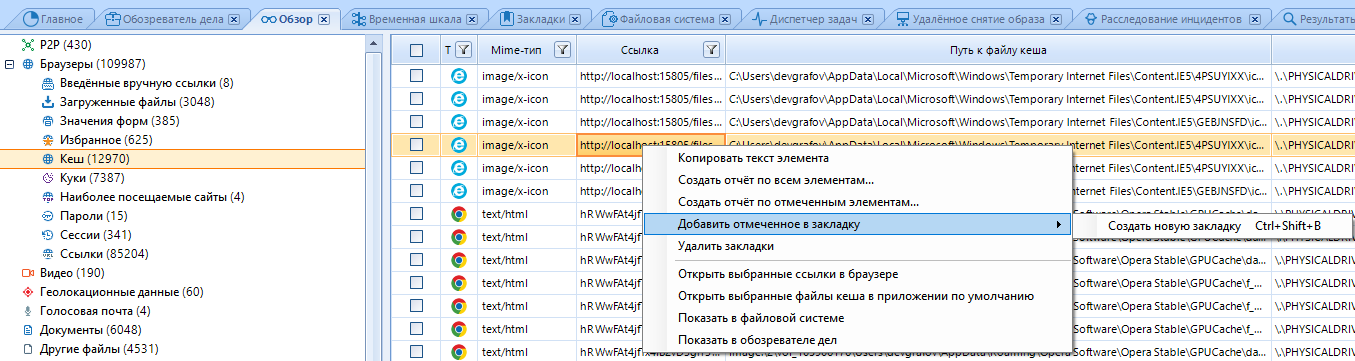
This page is blank by default. And you need it for quick access to important files for business. It turns out that you need to make a bookmark. You can make a bookmark in the "overview" or "case explorer " tabs
A bookmark is created with the keyboard shortcut Ctrl + Shift + B after selecting the elements we need, or RMB-> Add marked to bookmark-> Create new bookmark :
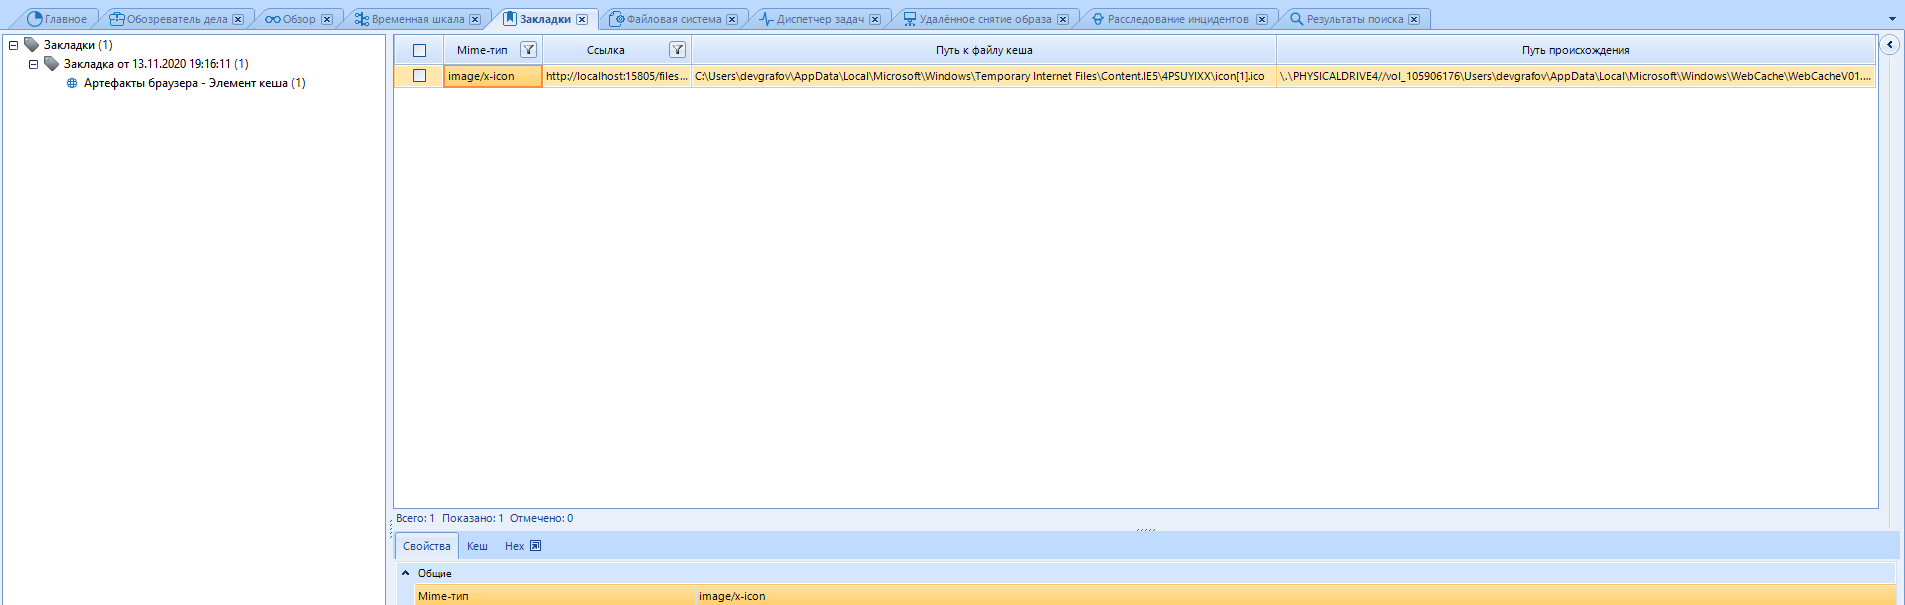
The item has been added to the “Bookmarks”, and if necessary, we will not have to search for it.
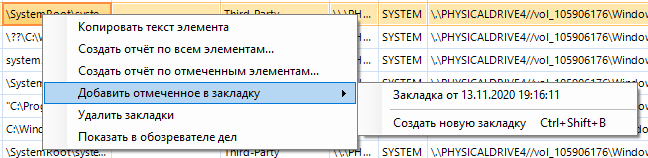
If you already have bookmarks, then when you select another, the program will offer to create a new one or add to an existing one:
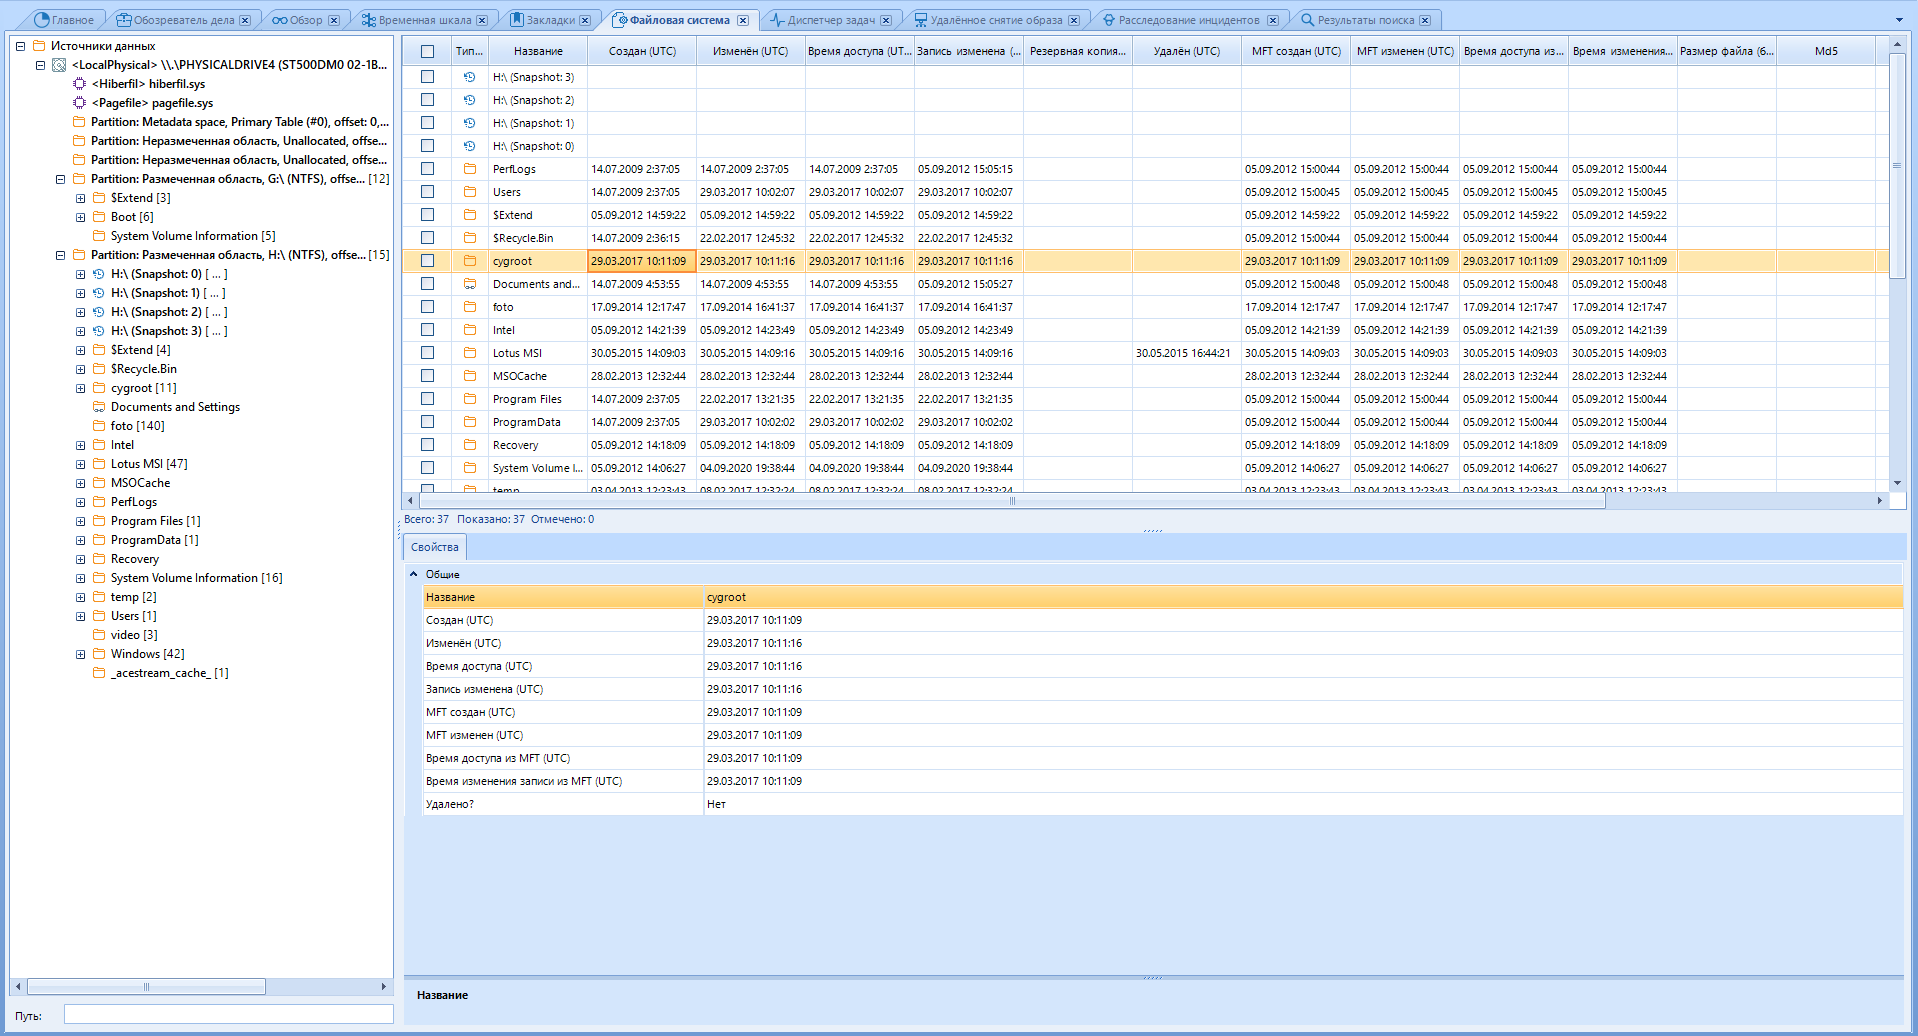
The File System tab is a built-in explorer that reads the properties of each of the folders and files:
Also, there can be visualized memory dumps, memory processes for a given RAM dump. However, in order to see the RAM processes, we will need to analyze the memory dump we are interested in and specify the “Enable BelkaCarving” option . We went through all this above.
I will say in advance that the BelkaCarving option greatly slows down the analysis of the RAM dump, so if you need to cut the dump only for artifacts, and you are not interested in the list of processes, do not select it
The file system window is divided into three parts:
● Data source structure (panel on the left)
● List of files or processes (panel on the top right)
● Information about the selected file (panel on the bottom right)
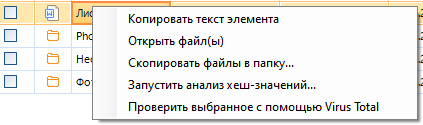
If we know the path to the final file, then we can open it in the explorer. Unfortunately, File Explorer doesn't have a lot of features. However, you can check the selection with VirusTotal or run the hash analysis of the file values:
Go to the "Task Manager" tab
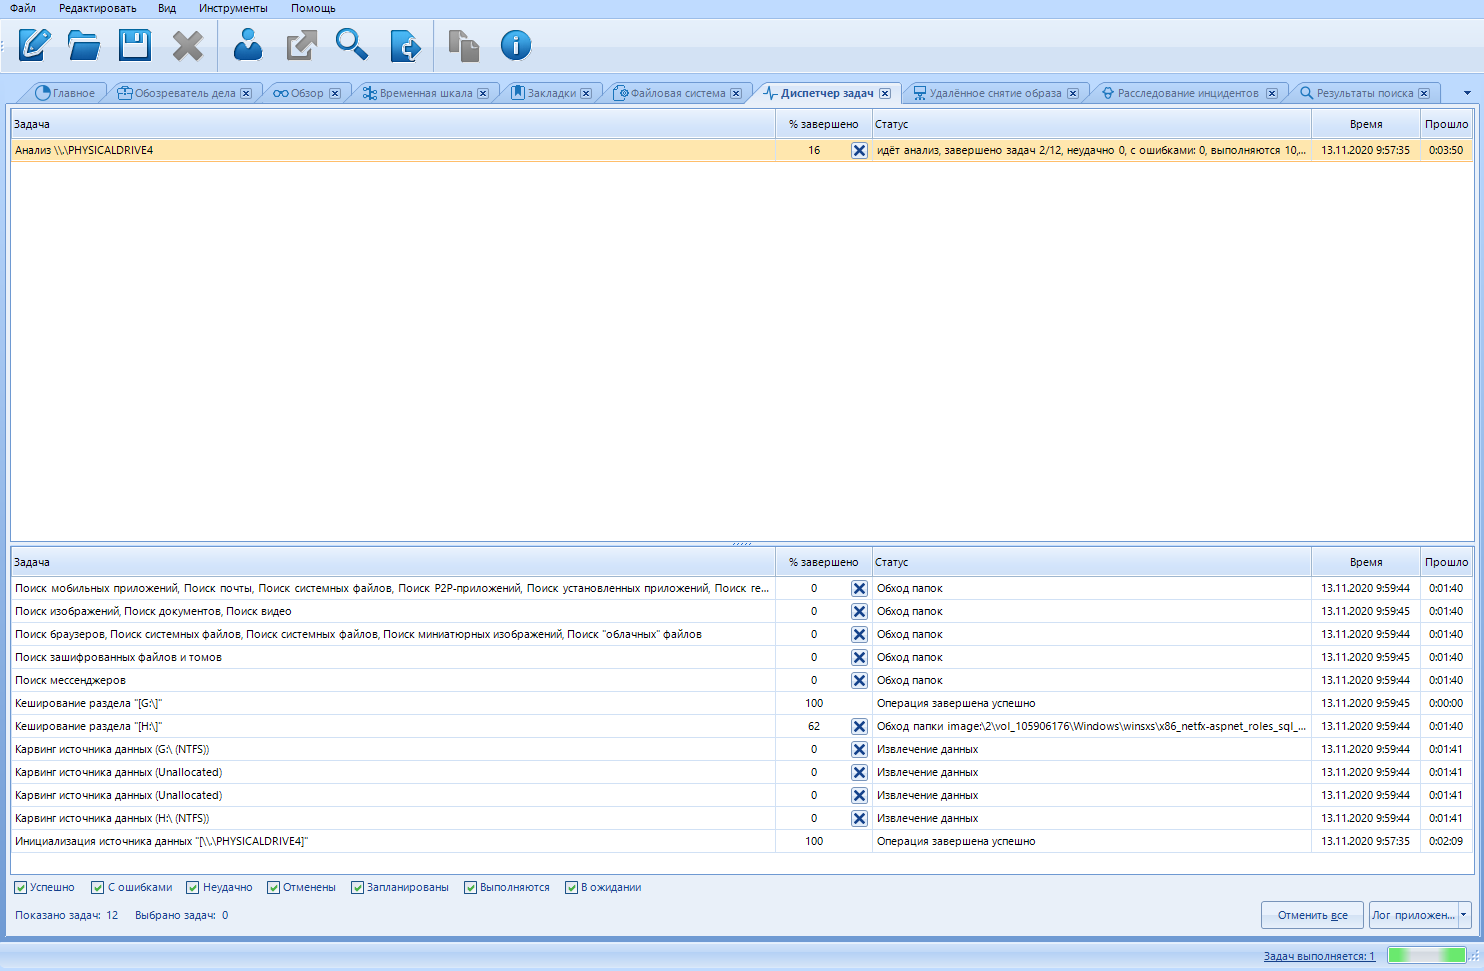
Here we can monitor and control all processes. At the top are the names of the main processes. When you click on such a process, a list of subprocesses appears in the lower window. It turns out that we can cancel unnecessary scanning processes. For example, if you started exporting a report in parallel with scanning, you can stop it by reducing the scanning time by unchecking the additional. load.
Also, each process is assigned a status. There may be several of them in total:
Successful
This status means that the task was completed without problems. For example, if it was an information retrieval process, then the information was retrieved without errors.
With errors
This status means that there were problems during the processing of the task. For an extraction / analysis task, this may result in the loss of some information. If, for example, there were still errors when extracting data, but the main process was successful, this means that the data was retrieved, but with some losses.
Failed
In contrast to the “miss” status, this status indicates that the task has completely failed. For example, if it is a file extraction, then no file has been extracted.
Canceled
This status is acquired only by the tasks canceled by the user (including those canceled due to the closure of the program). When canceling a task, the information provided will be incomplete, since the process has not reached the end.
Scheduled
This status means that the task is scheduled, but not yet operational \ not started. This happens if there are too many tasks and their simultaneous execution will slow down the entire process. Therefore, some tasks are postponed until the processor core is free to complete them.
In Progress
This status means that the task execution is in an active process. The execution time depends on many factors: on the selected types of analysis, processor speed, RAM size, or the speed of the hard disks themselves (both studied and working).
Pending
Some tasks require user input, such as user password to decrypt stored passwords, Dropbox data. Tasks that require user input are not executed and are placed in a pending status.
You can customize the display of tasks with different statuses in the bottom menu:

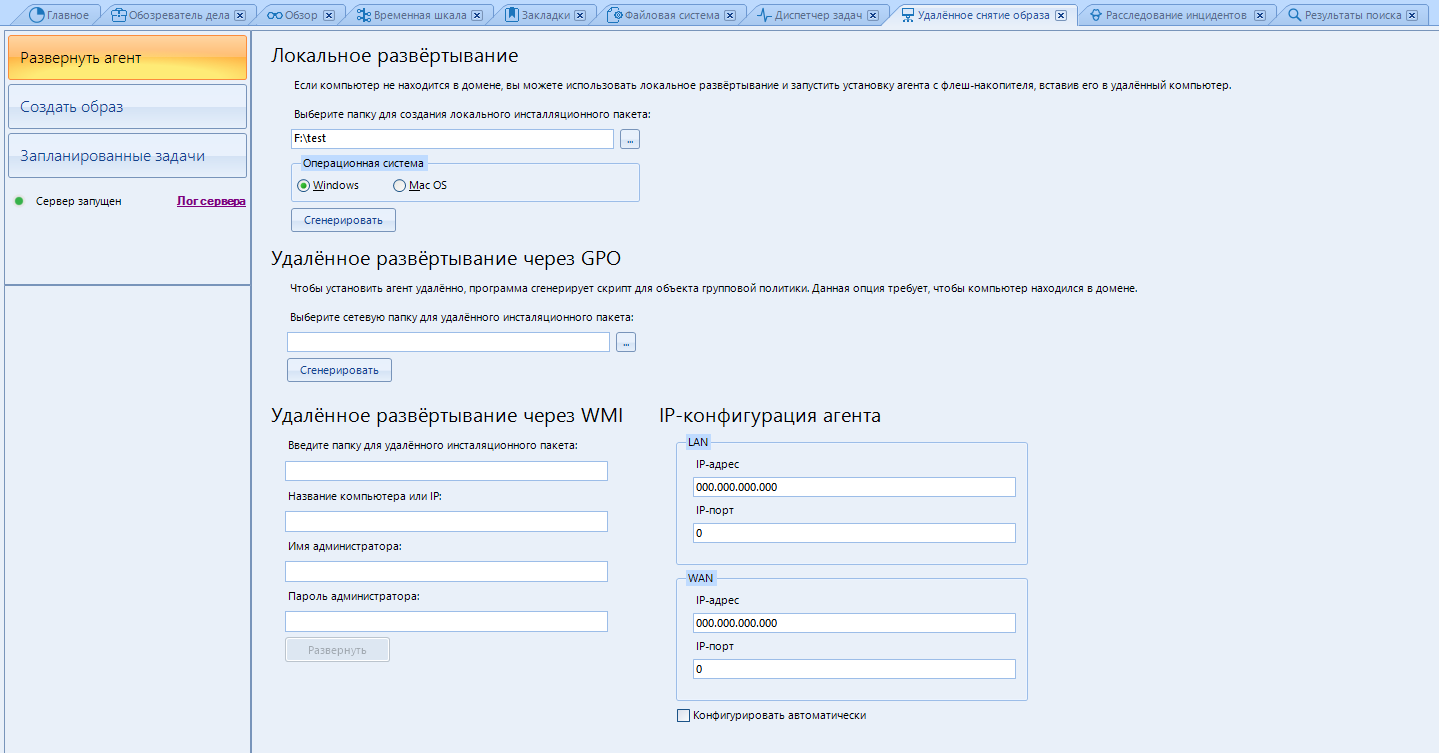
Now almost the final tab - "Remote image capture"
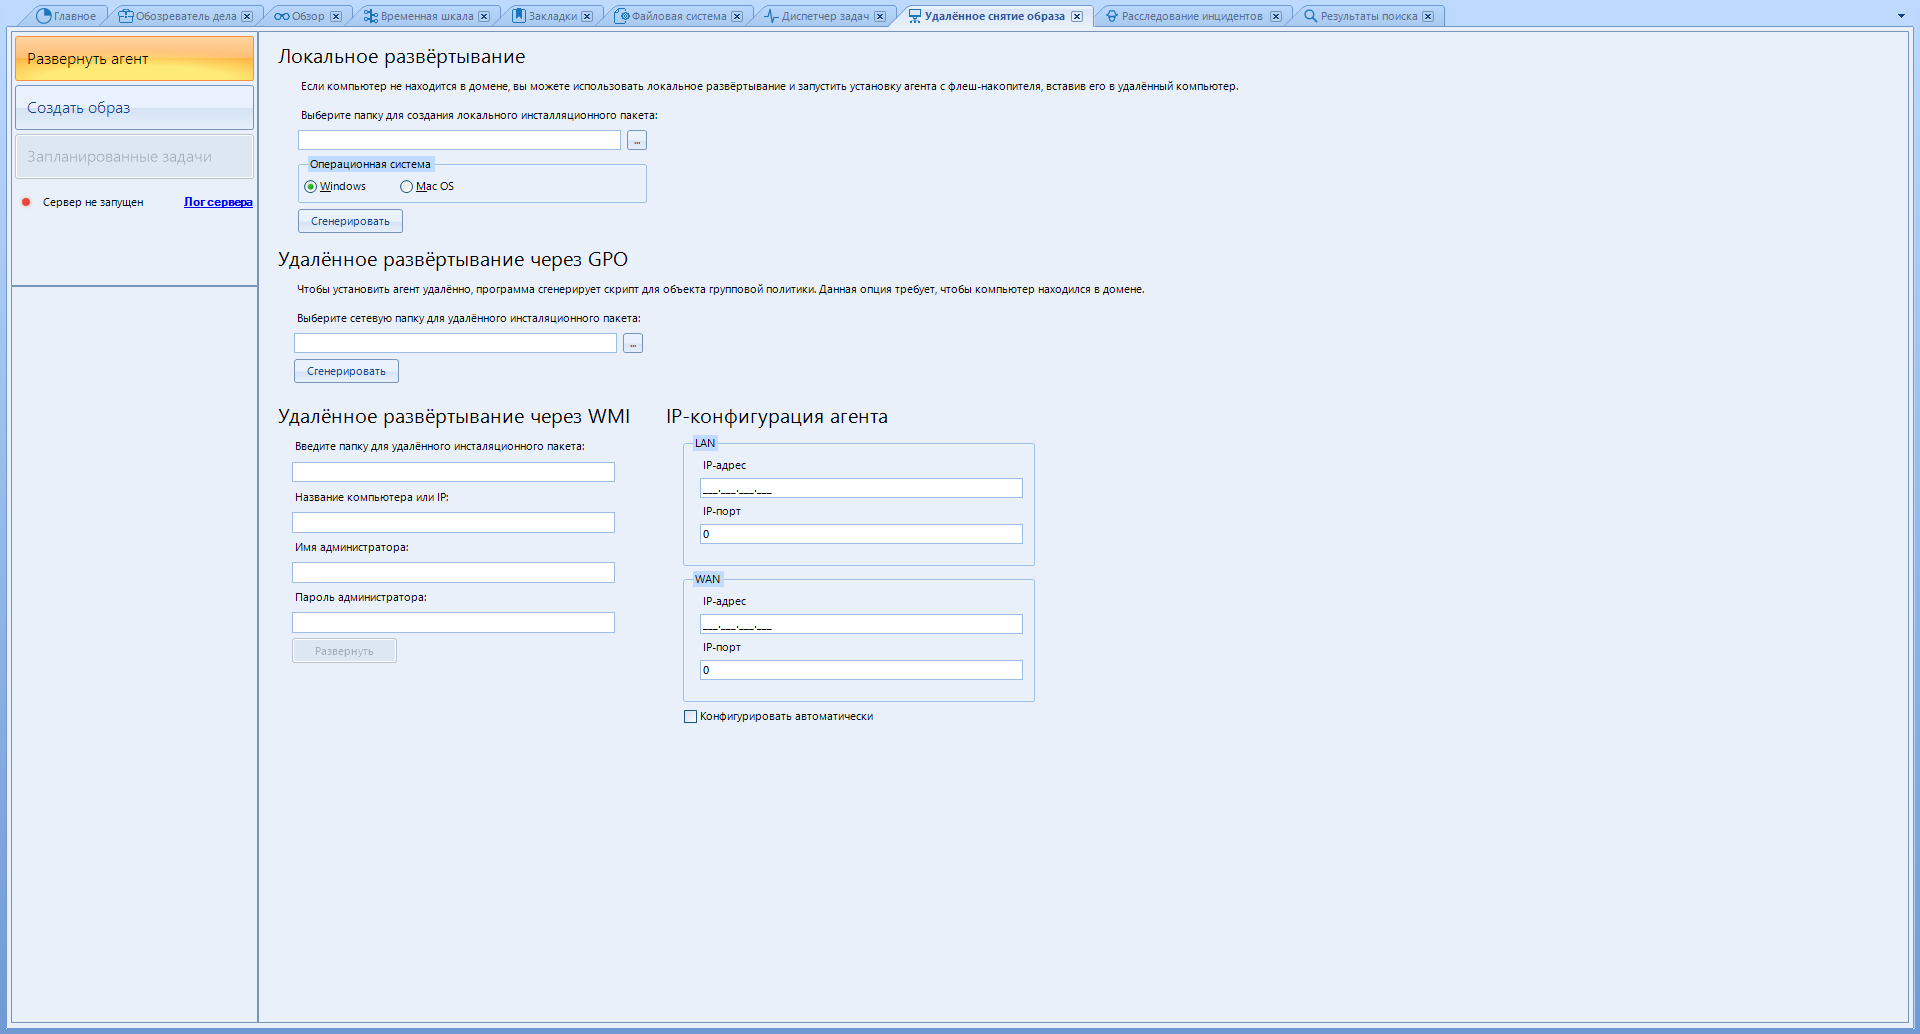
As I said, this program allows you to collect data from remote devices. This feature is available with a separate remote data acquisition module. We have it.
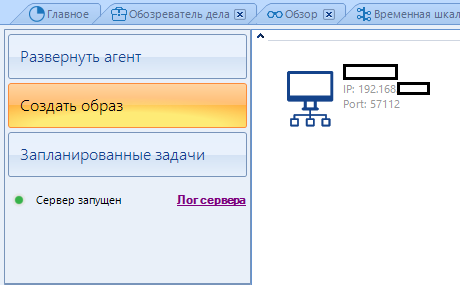
There are only three buttons in the left menu:
Deploy Agent - Prepares a deployment package for remote installation.
“Create Image” - Creating an image is obvious.
“Scheduled Tasks” - Scheduling the time when to download the received data to your computer.
To create a package for local deployment - use the "Local deployment" menu
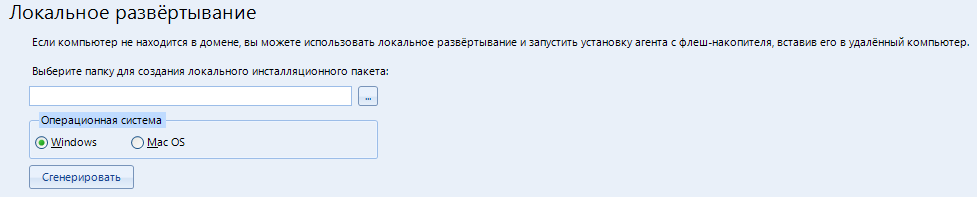
Pay attention to the tip about the flash drive.
Now I will show you how to work remotely over a local network.
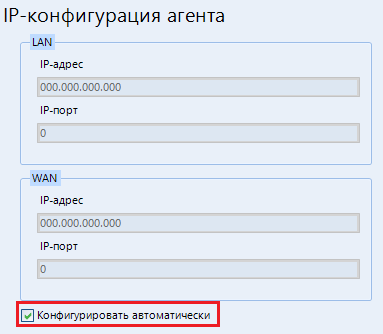
In the item "IP-configuration of the agent", in order not to mess around, put a daw on "Configure automatically"
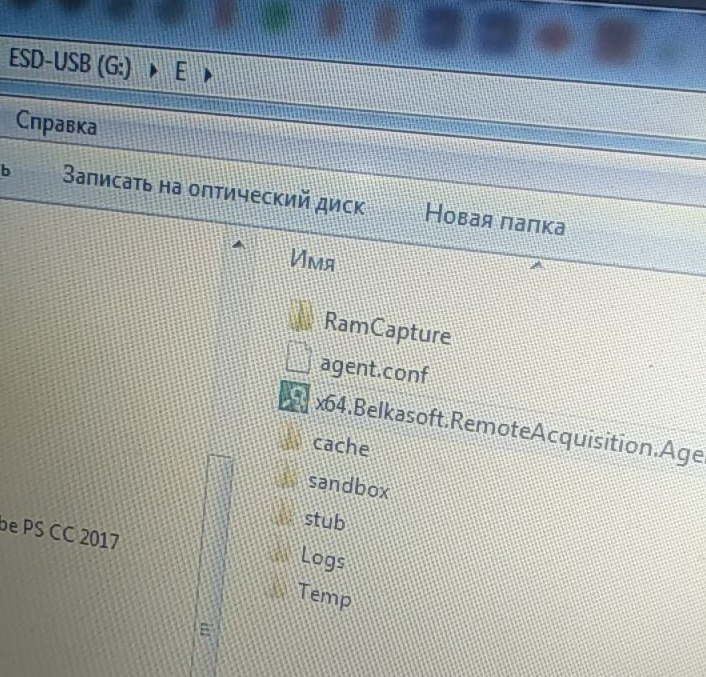
In the Local Deployment menu, specify the folder for creating the file. Then we select the operating system that we will scan and click “Generate” . The following files are created in the selected folder:
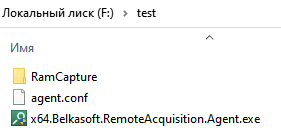
It is them that we must transfer to the scanned computer. We put it on a USB drive and carry it to the patient.
To start the server - configure the “network” parameter in the settings (Tools-> Settings-> Network). You can read about this above, closer to the very beginning.
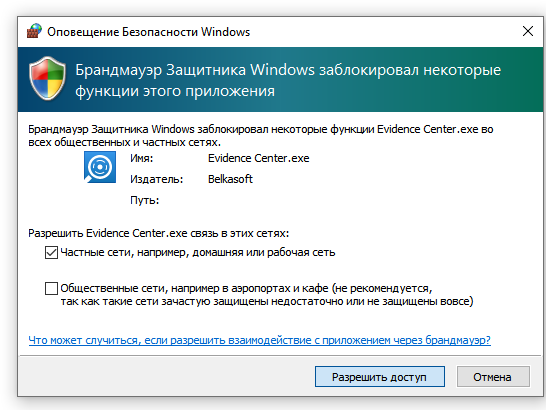
We grant access and ...
We have deployed the server and are ready to scan remote devices.
If you still have the server - click on "create an image" . Then the program will update the configuration and the server should work. Otherwise, check the correctness of the entered data in the settings.
And no, we won't be looking at working through GPO or WMI.
Now we deploy the agent on the patient. I did it straight on removable media, which was a mistake. It is better to copy the main file to a folder on the desktop and deploy the agent already there
Now go to the "Create Image" item. The computer on which we installed the agent should appear there:
Click on it and select from the window that opens from which source we will shoot the image.
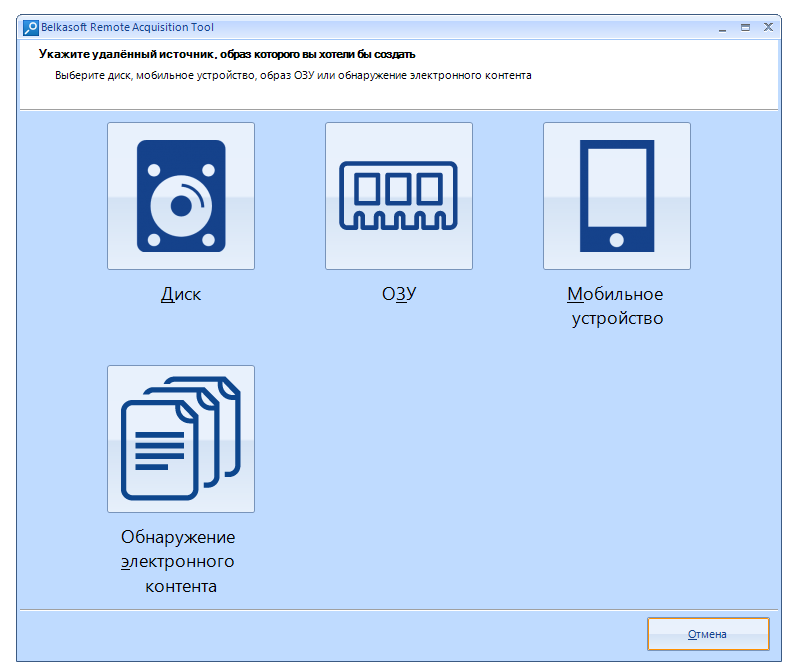
I will be making a disk image, so I select "Disk"
Then a new menu opens. We continue to work with him.
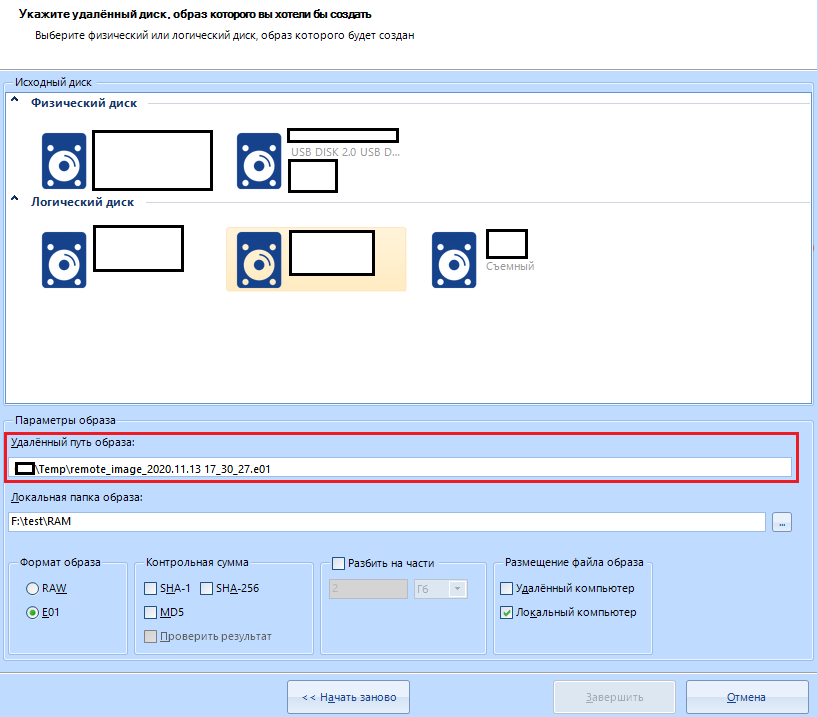
In the item "Image parameters" we will have to select the path on the scanned device where the image will be saved. For example, I will make a cast of a flash drive. I select the removable disk and fill in the next item - “Local image folder” . The image will be downloaded here to our computer.
In the image format, I select the compressed E01.
It is better not to touch the rest of the settings, or configure the same as if you were capturing the image not from a remote, but from a local disk.
"Location of the image file" select "Local computer". Only then will the file be moved from the scanned computer to our working one. This is done for reliability.
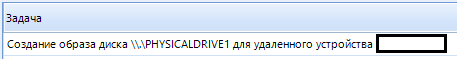
I click "Finish" and the following task appears in the "Task Manager" tab:
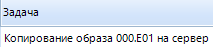
at the end of the image creation process, copying it to the server (to our machine) begins:
After completing all the copying work, we can open this image from its destination folder.
This is where you can finish the part about working on the network and move on to the next tab.
"Investigation of incidents"
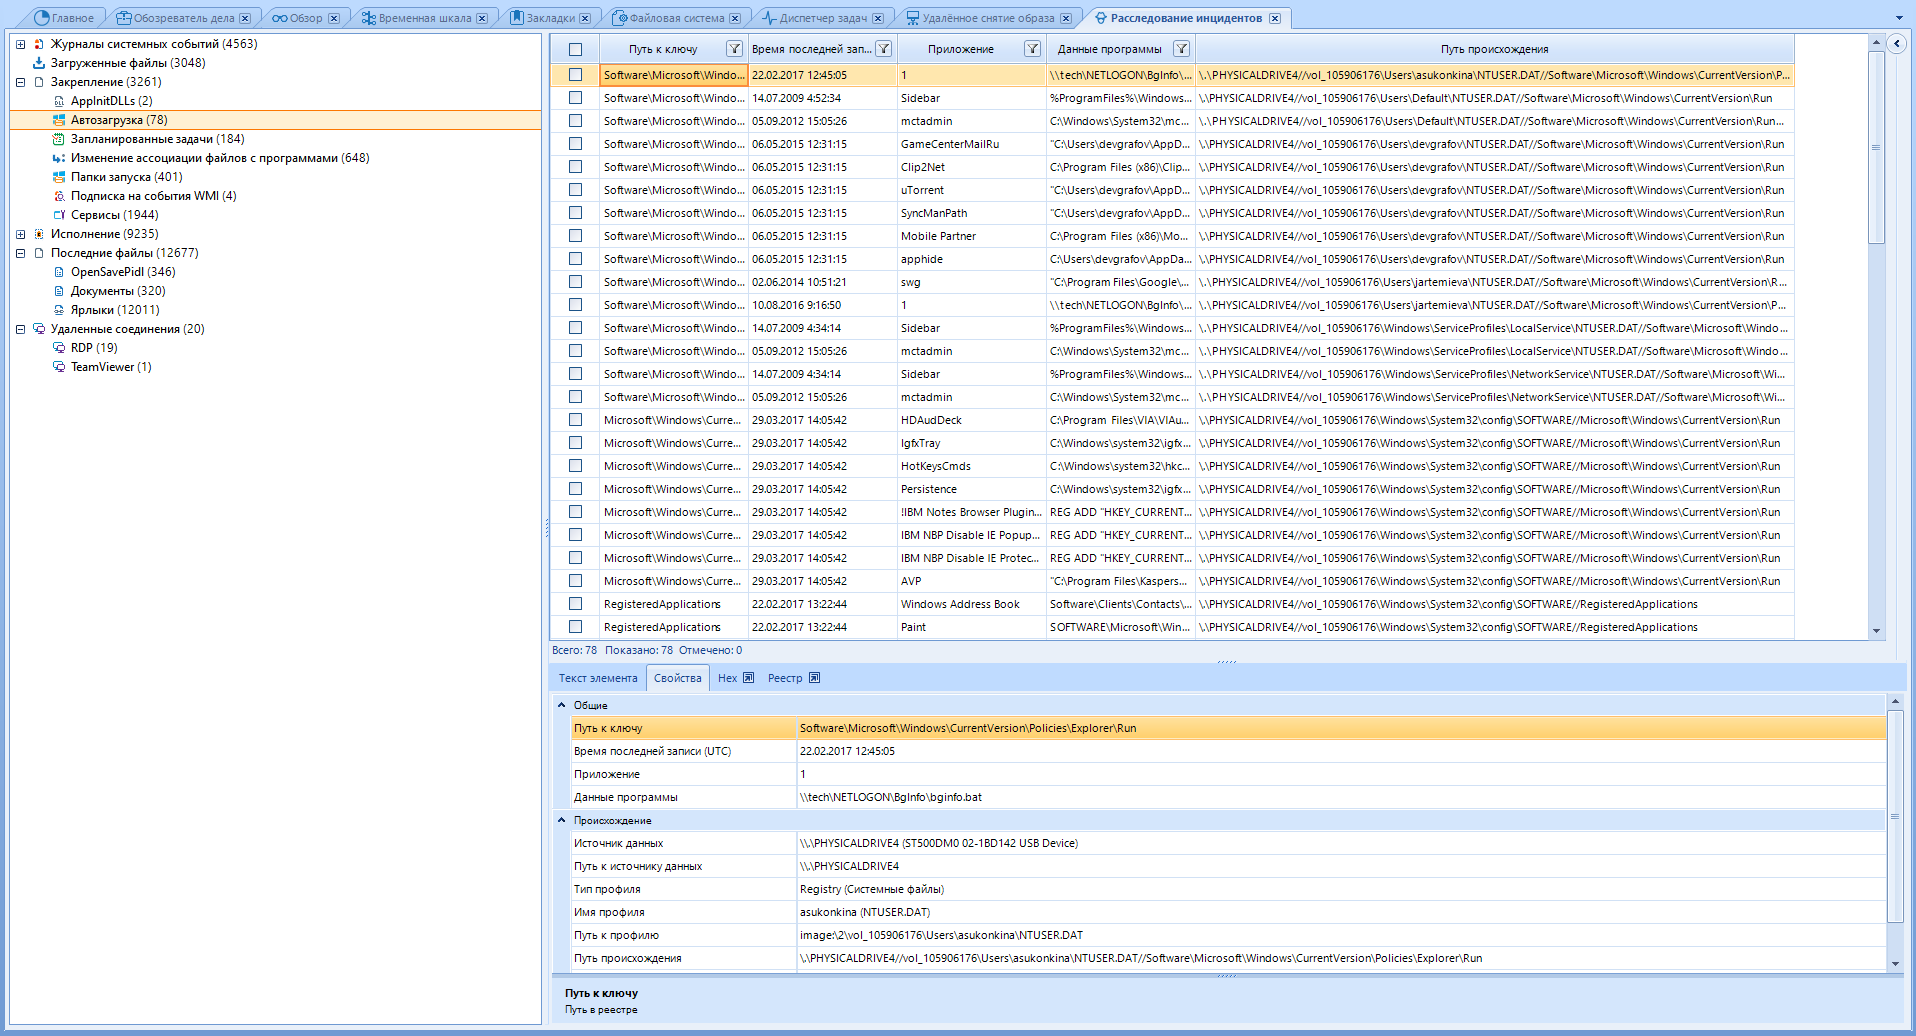
The program can help in the investigation of incidents if something happened on a computer running Windows.
This window brings together various artifacts from various data sources, such as the registry, event log, and others, that can assist in the investigation. These artifacts can confirm the execution of malicious code on the computer and scan remote connections to check where it (the malicious code) sent information.
Some of these artifacts are displayed in the Overview and Case Browser windows, but inside the Incident Investigation window, they are not mixed with common artifacts, which allows you to focus on studying a specific direction of the attack vector.
The Plist Viewer, SQLite Viewer and Registry Viewer windows require their extension files to be loaded. I will not consider them for the reason thatI do not want either I do not have the necessary files (Plist), or we have already gone through this earlier (SQLite, registry).
However, we will look at the “Hex Viewer”.
To open it, click on View-> Hex Viewer.
After opening this window, we will be asked to select one of the existing files. We can select it both from our working disk and from the scanned one. I will open a random picture from my disk in it.
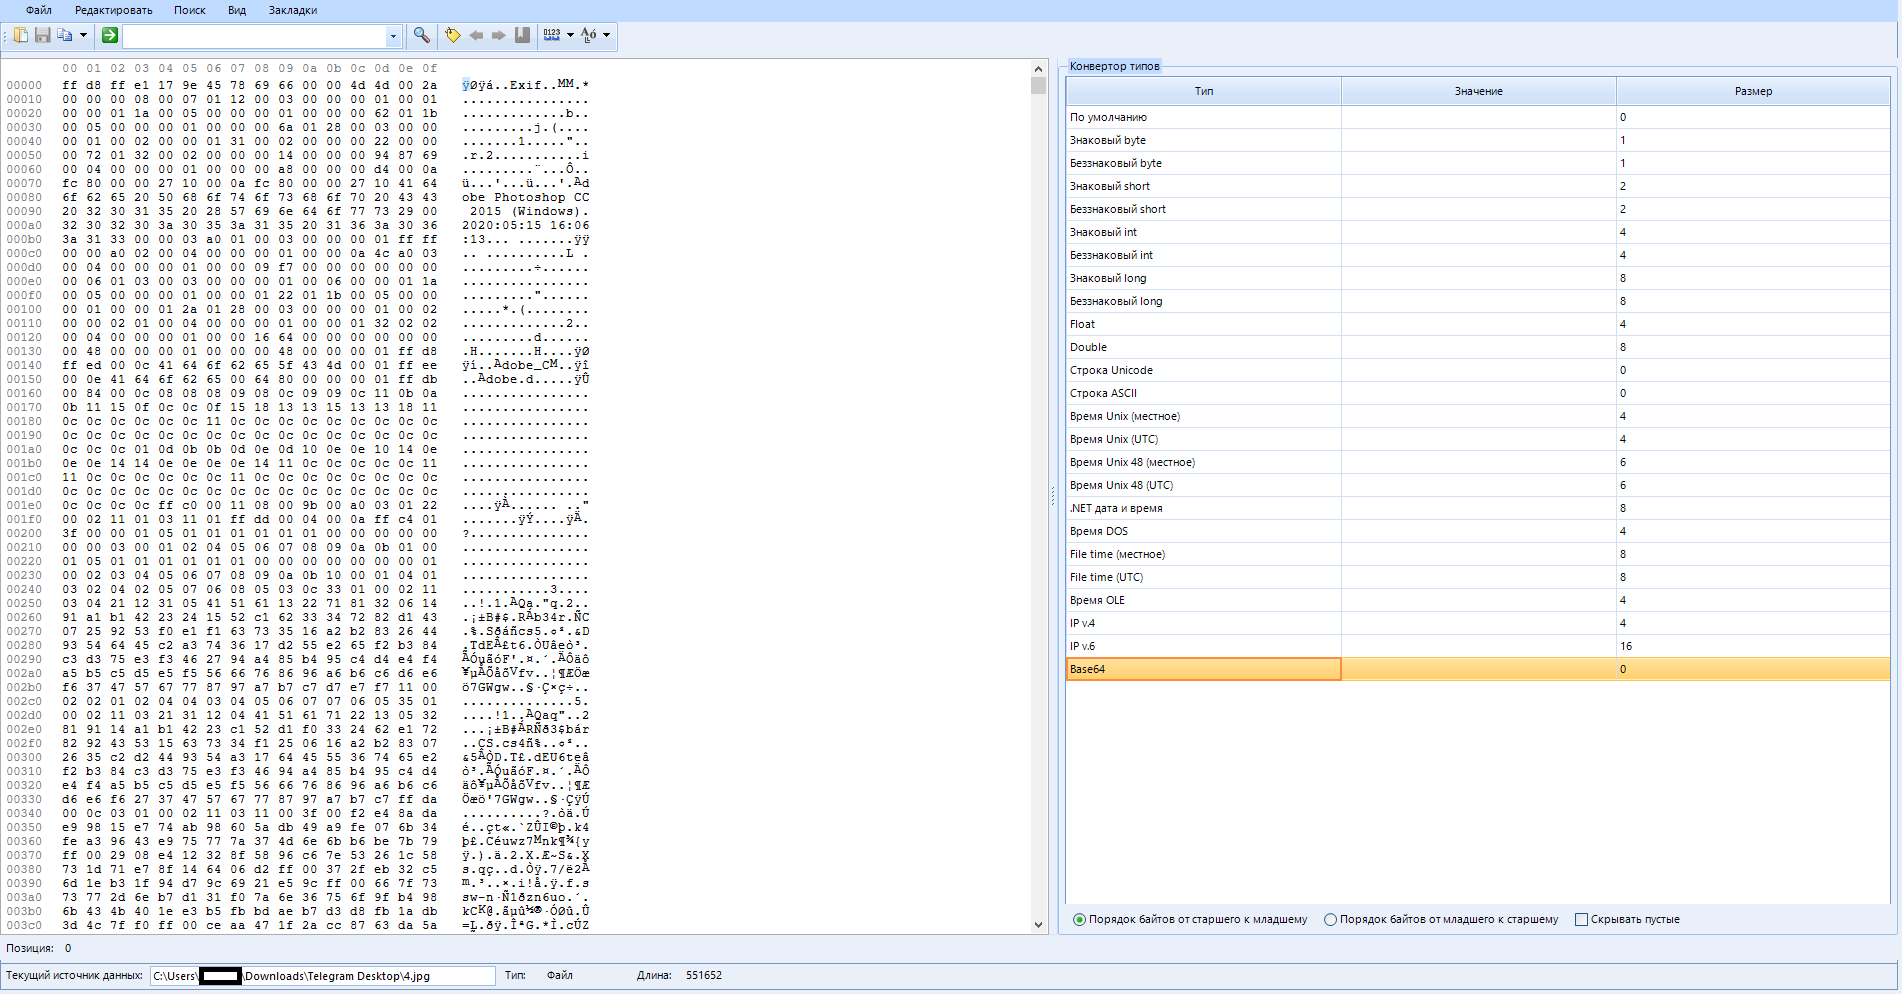
This window shows the raw content of the selected item (artifact), which can be a file, process, data source, or section from your case. A lite version of this window can be found in the artifact properties panel in other tabs. I'm sure you remember that.
The window itself is divided into three panels:
Top
Search and basic functions here.
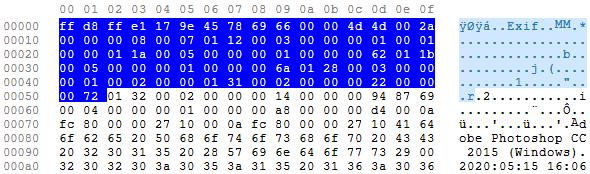
Raw data (left)
Here you can see the actual hexadecimal data for the element we selected earlier (In my case, this is a picture) and its string representation.
Type converter (right)
In this pane, you can see how the bytes currently selected in the raw data pane are minified using different types such as byte, ASCII, Unix time, or Unicode string.
first, let's look at the top menu:

Here are the basic settings.
File
Lets you open a new file, or save the selected area of raw data to a new one.
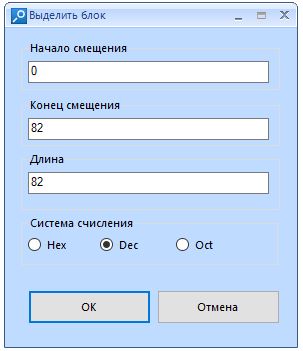
Edit
Copy the selection as text or hex value. It is possible to select everything or select a block. When selecting a block, you will need to configure:
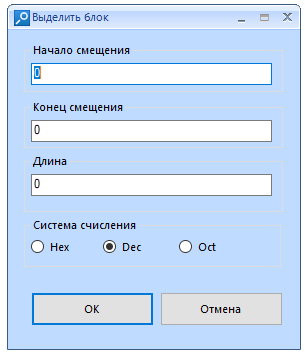
"Offset start" - here we enter the ordinal number of the byte we need. I warn you that the reckoning starts from zero.
End Offset is the ending byte to allocate. Filled in automatically when changing the "Length" parameter
“Length” is the total length of the block. Filled in automatically when changing the "End of offset" parameter
“Number system” is the system in which you specify the length of the block. For convenience, I advise you to leave DEC. When changing the system, the previously entered values in another system are converted to the specified one.
Example:
Search
Search by text or hexadecimal value. There is a function of extended transition to a specified byte sequence number.
Hot key combinations:
F7 - search
F9 - search next
Ctrl + G - Go
View
Setting the display of raw data:
String size (from 8 to 48 bytes), encoding of the string representation of raw data, address type (Hexadecimal, decimal, octal), byte grouping (from 1 to 8 bytes)
Bookmarks
Add a bookmark to the selected data area. Allocates bytes
Now let's look at the icons:

Open file.

Save selection to file

Copy selection as text or as hex value

Jump to the specified byte. Has a search history.

Search function for text or hexadecimal value

Adding a bookmark (highlighting bytes)

Move to the next or previous bookmark.

Setting up bookmarks. You can customize the start, length, color, add a name and description of the selected bookmark.

Choosing a row size

Choosing the encoding of the raw data string representation
We are done with Hex, you can send to the next tab.
"Link graph"
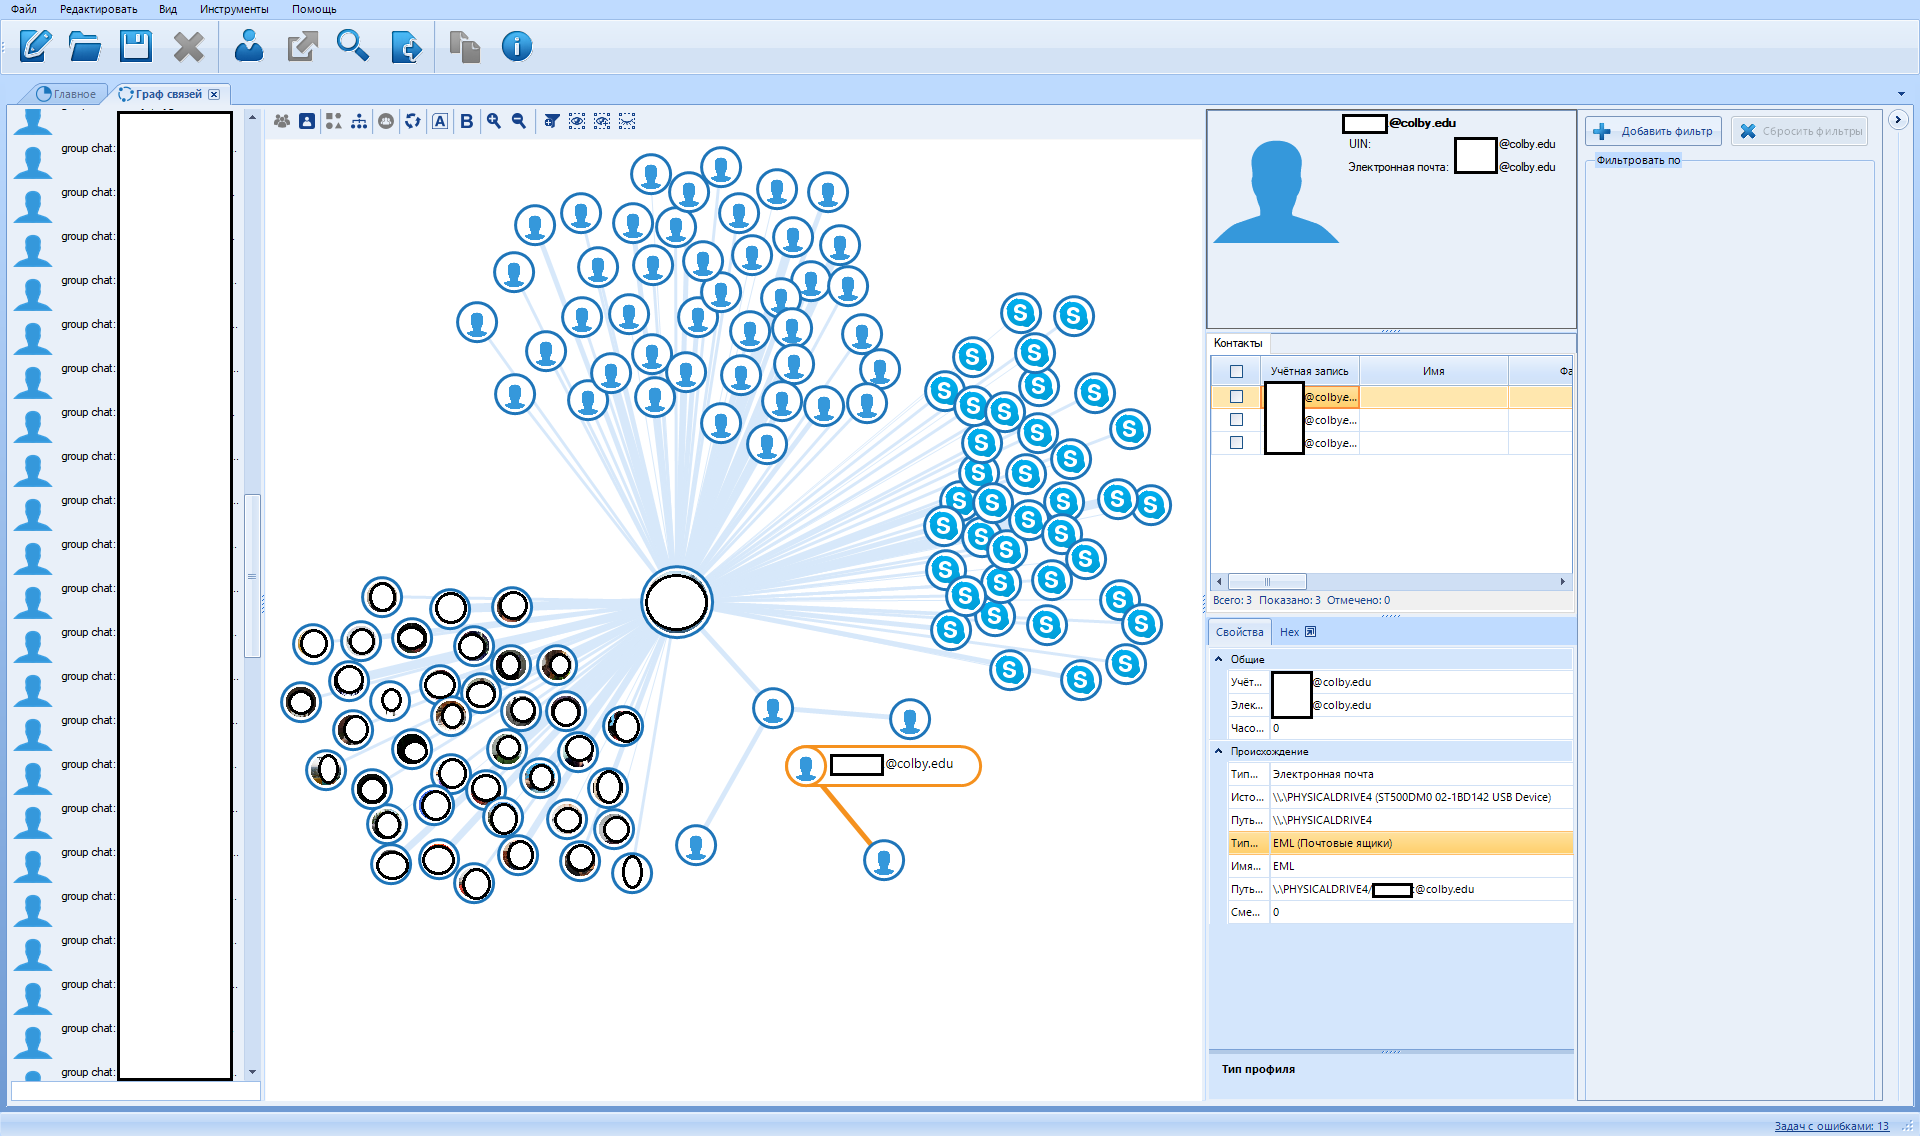
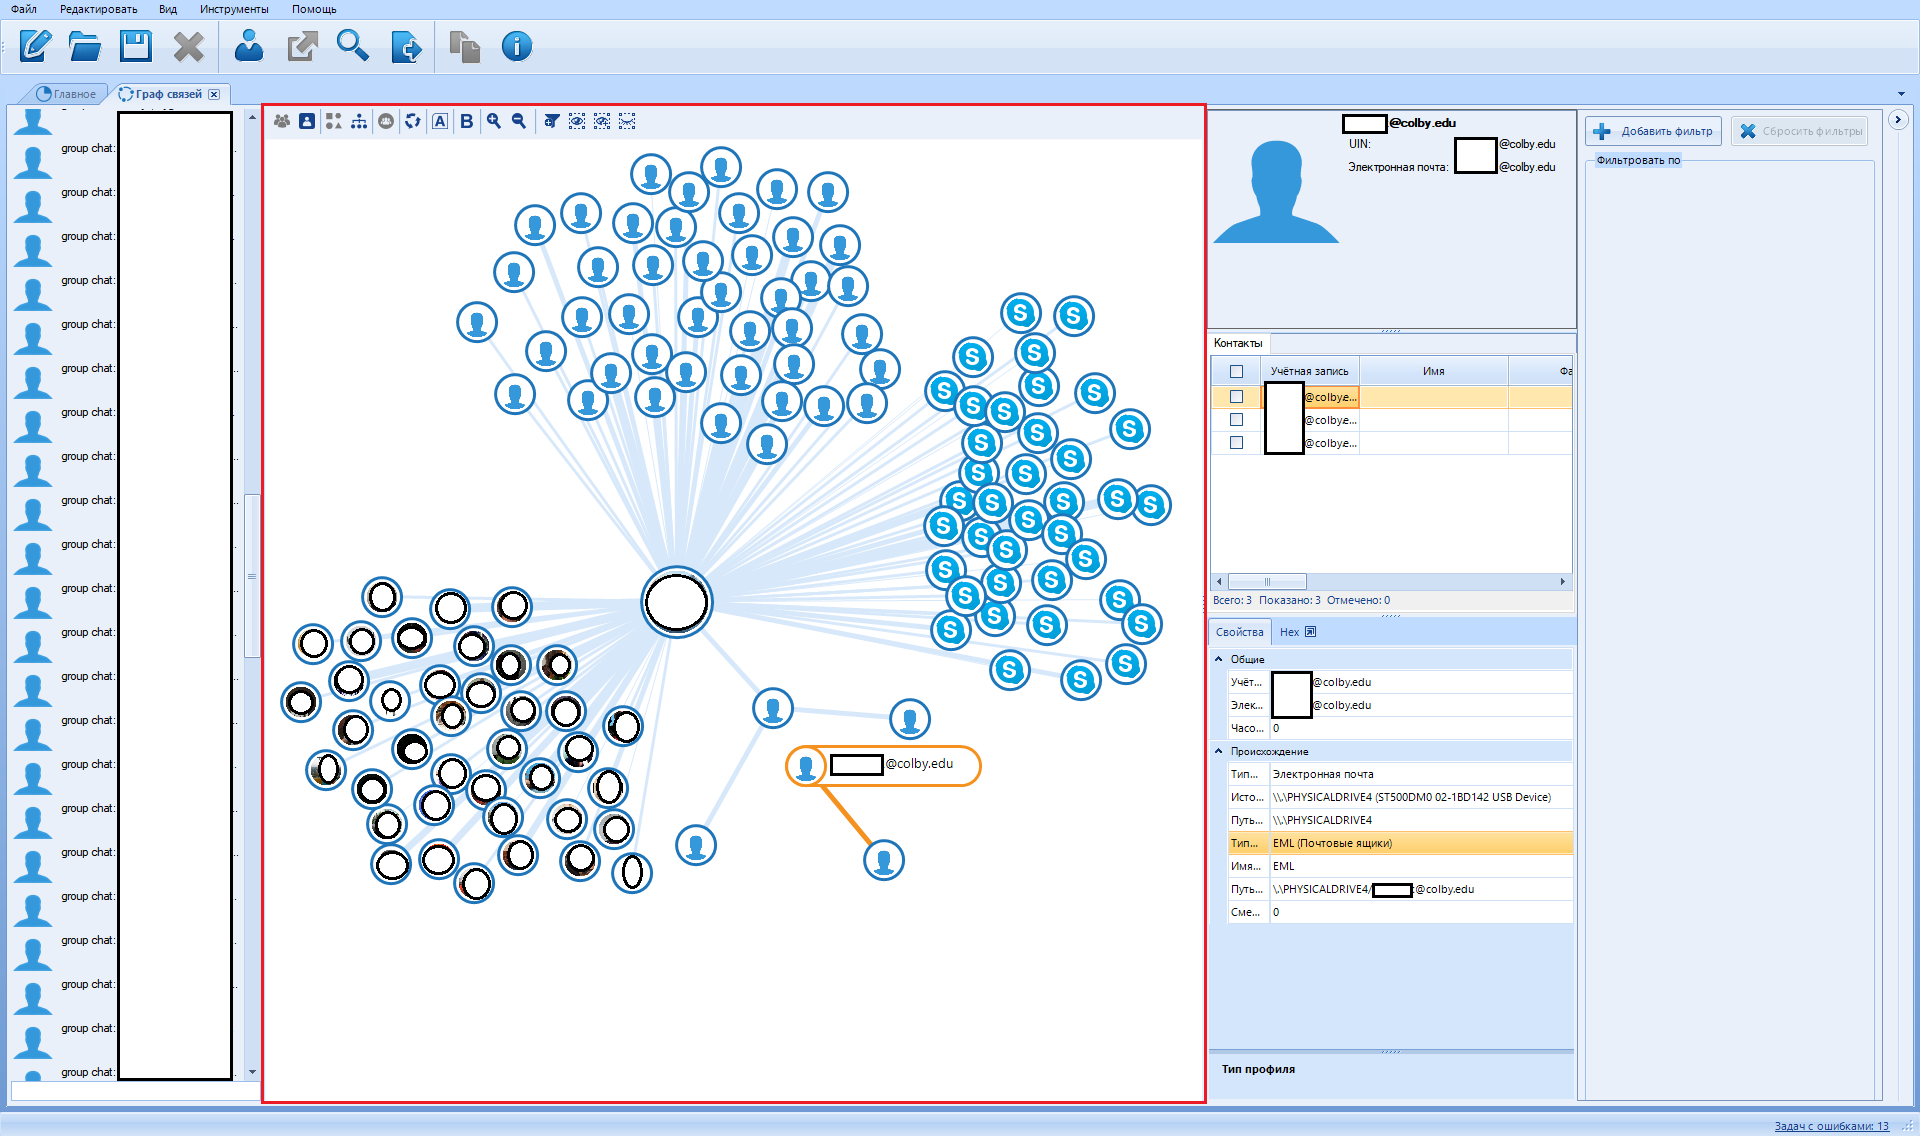
In this tab, the program visualizes the communication between the people involved in the case. This window shows people in dots (or their avatars) and connects them with lines in case these people had one or more occurrences of various types of communication, such as calls, SMS, Chat, E-mail messages, file transfers, etc. ...
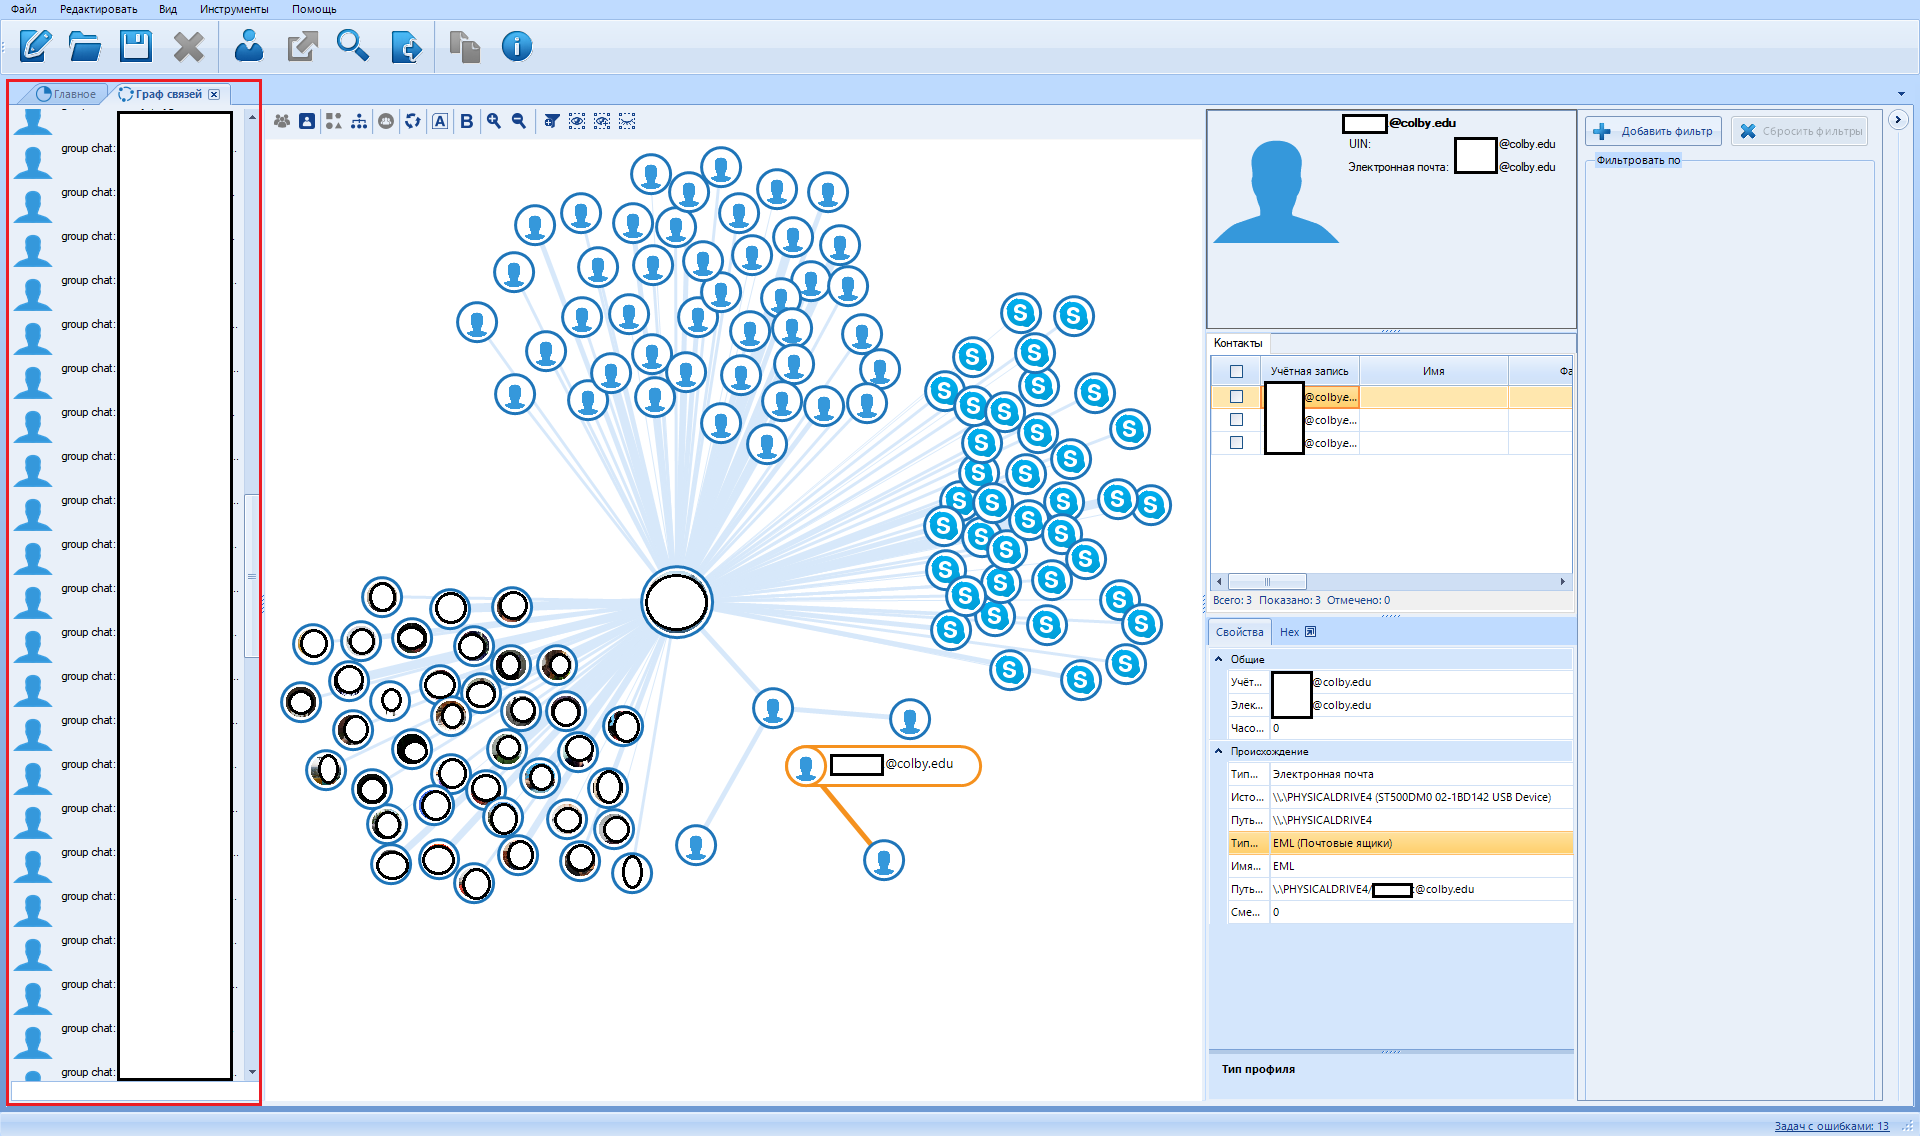
In the middle is a visualized contact graph:
The first column on the right is information about the selected contact.
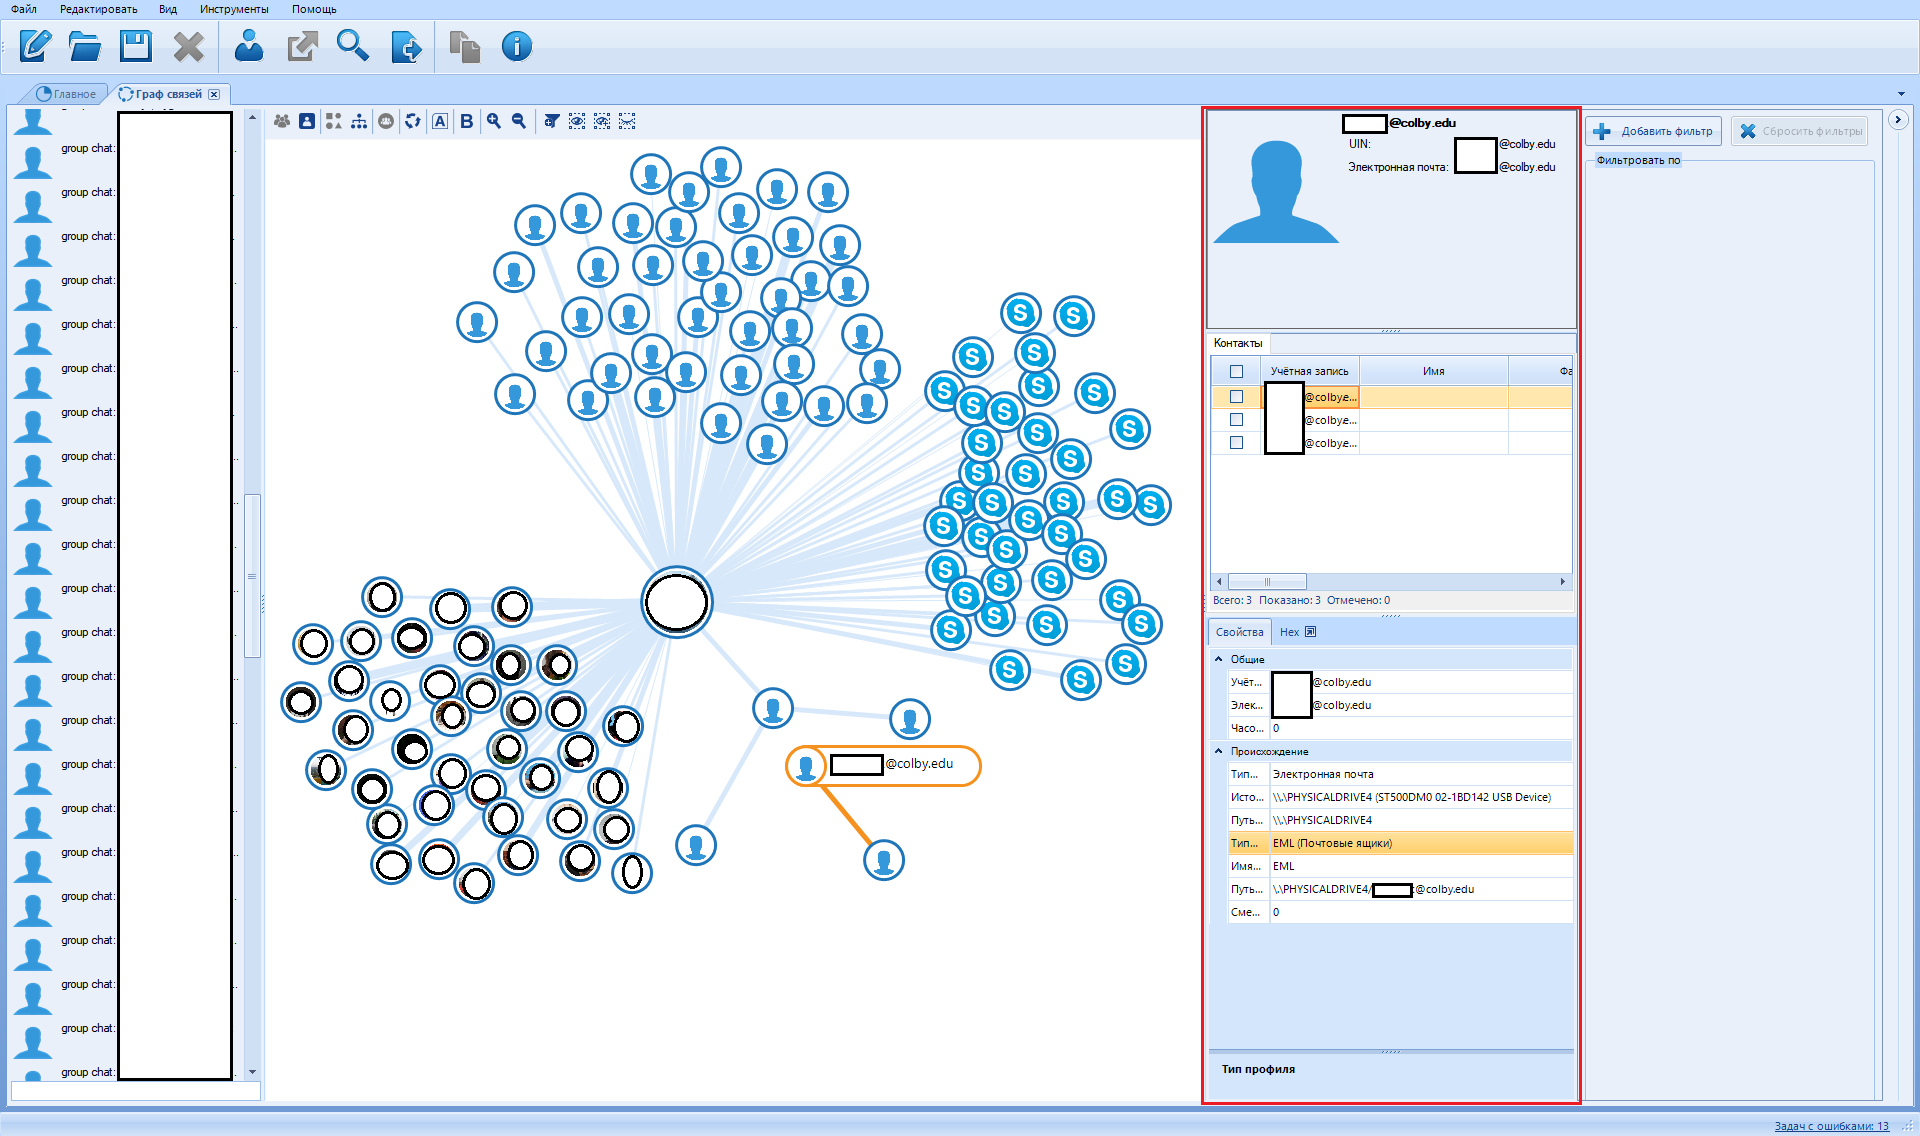
The second from the right is the rendered data filter:
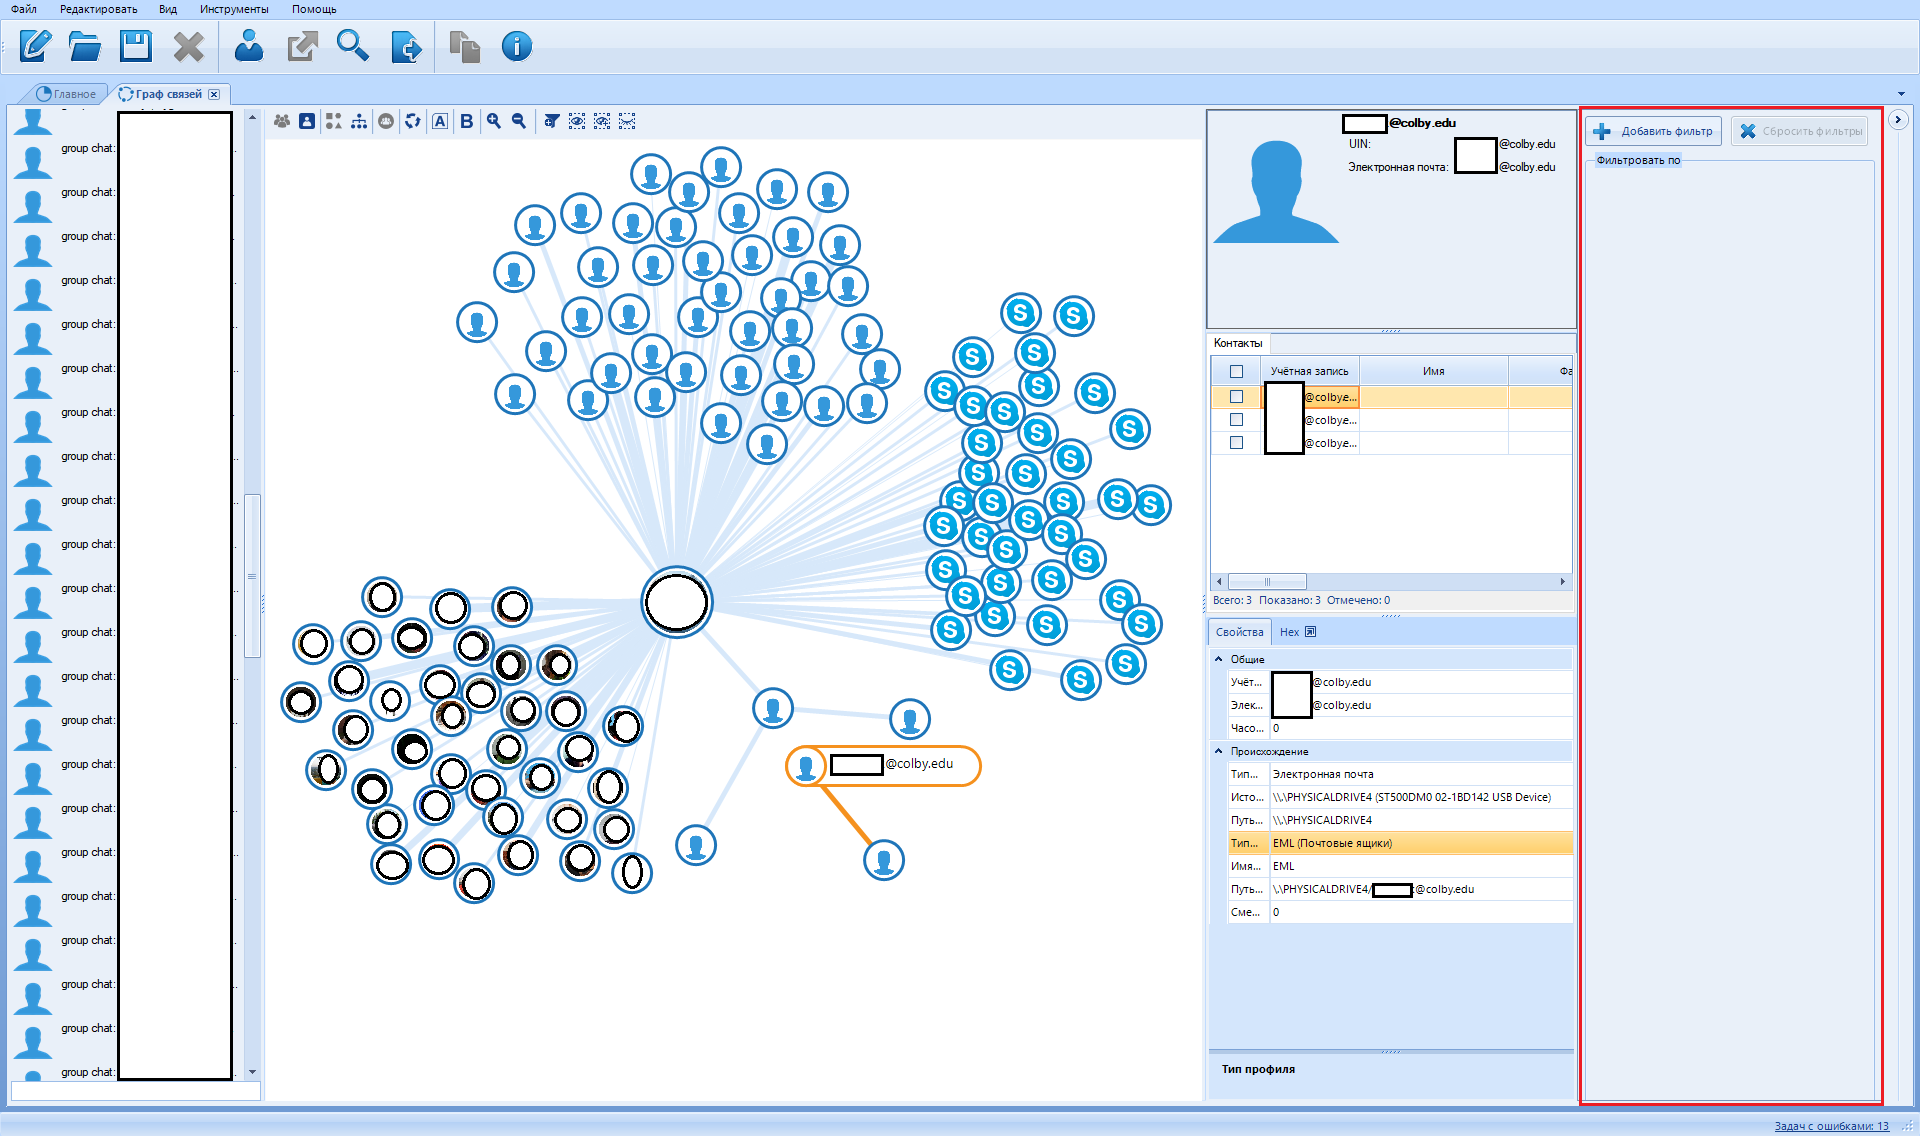
To add a filter, click on the "Add filter" button
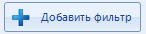
You can install only three types of filter:
Filter by profiles
Filter by source
Filter by contacts
In addition, each filter has a search that can be used to avoid scrolling through huge lists.
And finally, let's talk about this panel:

So what we see here:

Let's go in order.
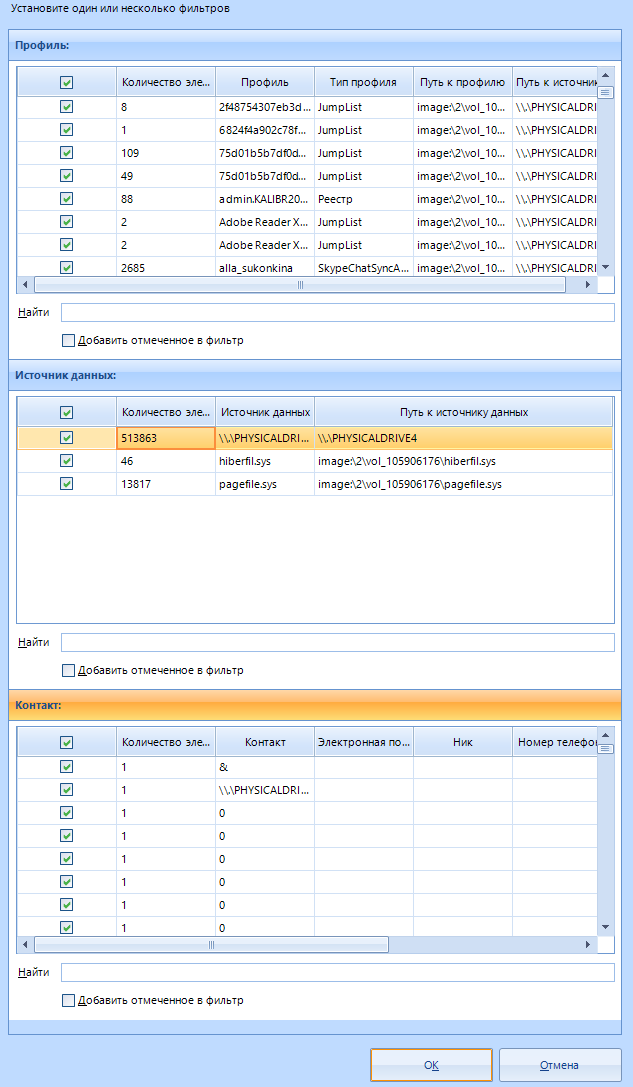
Entity graph

This button switches the graph view mode from contacts to entity graph. The entity graph contains fewer vertices, so it is easier to interpret. No, it's really called that.
Next - the contact graph

In contrast to the entity graph. Contains more detailed information about the communication means used.
Icons

This button switches the mode of viewing vertices from points to icons. In this mode, all contacts or objects are displayed using the icon of the application to which they belong or an avatar. That is, if a Skype contact was found, then either its icon or the user's avatar will be displayed.
Points

This button switches the mode of viewing vertices from icons to points. Thumbnail view can take up a lot of space, especially when displaying contact avatars.
Discovered communities

After clicking on this button, a procedure for detecting closely related people, which is called a "community", is launched . One such community is made up of people who probably know each other very well.
Rebuild layout

Rebuild the relationship graph. If you've made a mess, this function will clean up the mess (it will only make everything worse). If communities are found, the software will try to keep the top of the community together.
Hide titles

Hides or shows back (when pressed again) the names of found contacts. I used this feature to keep a bunch of names from being blurred for the screenshot. Used mainly to keep a lot of text from messing up like this:
Show weights

Some contact relationships are more important than others. For example, if they have more correspondence, calls or emails, then the program considers them as a priority. Here you can distinguish such arcs in order to visually distinguish such communications
Decrease \ increase

Move closer to or away from an area. The mouse wheel can serve as a substitute for this function.
Add filter

Analogue of the second button "Add filter"
Leave only selected vertices

This button hides all the vertices of the graph except the selected ones.
Leave selected vertices and their neighbors

After clicking, all vertices not associated with the selected one are hidden.
Hide selected vertices

This button hides all the selected graph vertices, the rest remain visible.
Now we move on to the last tab that we need to consider.
The window titled “Search Results” is a set of data that the program was able to dig up in the source using the search function.
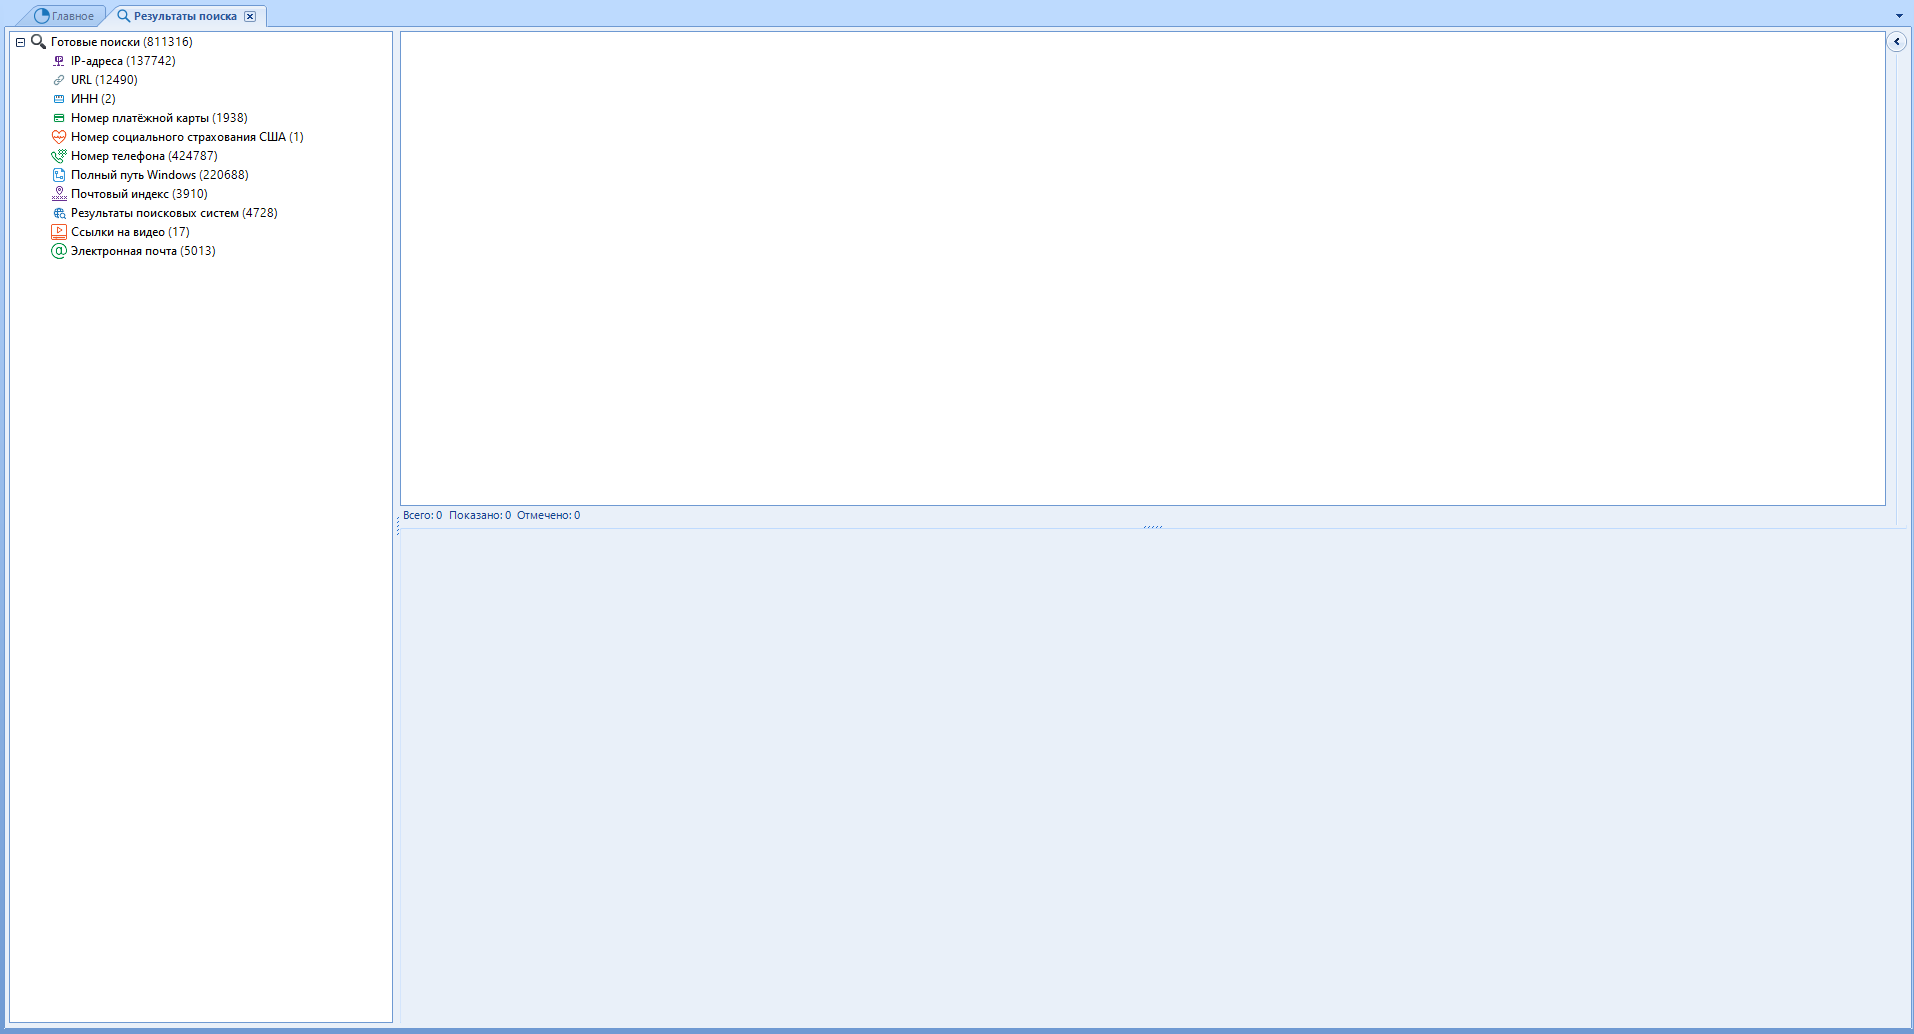
All data found by the specified parameters will be added here. I advise you to use the search function only after completing the main work of the program.
Standard scanning provides a basic set of data for search: IP, URL, TIN, Maps, Soc. fear., Rooms and the like.
This will add the result of any search, which you can start with the Ctrl + F key combination . Yes, we passed this point above
For example, I scanned my hard drive for prohibited material and the result was added as a new line of data.
To view the list of found artifacts, double-click on the line of interest to us. The familiar menu will open on the right side:
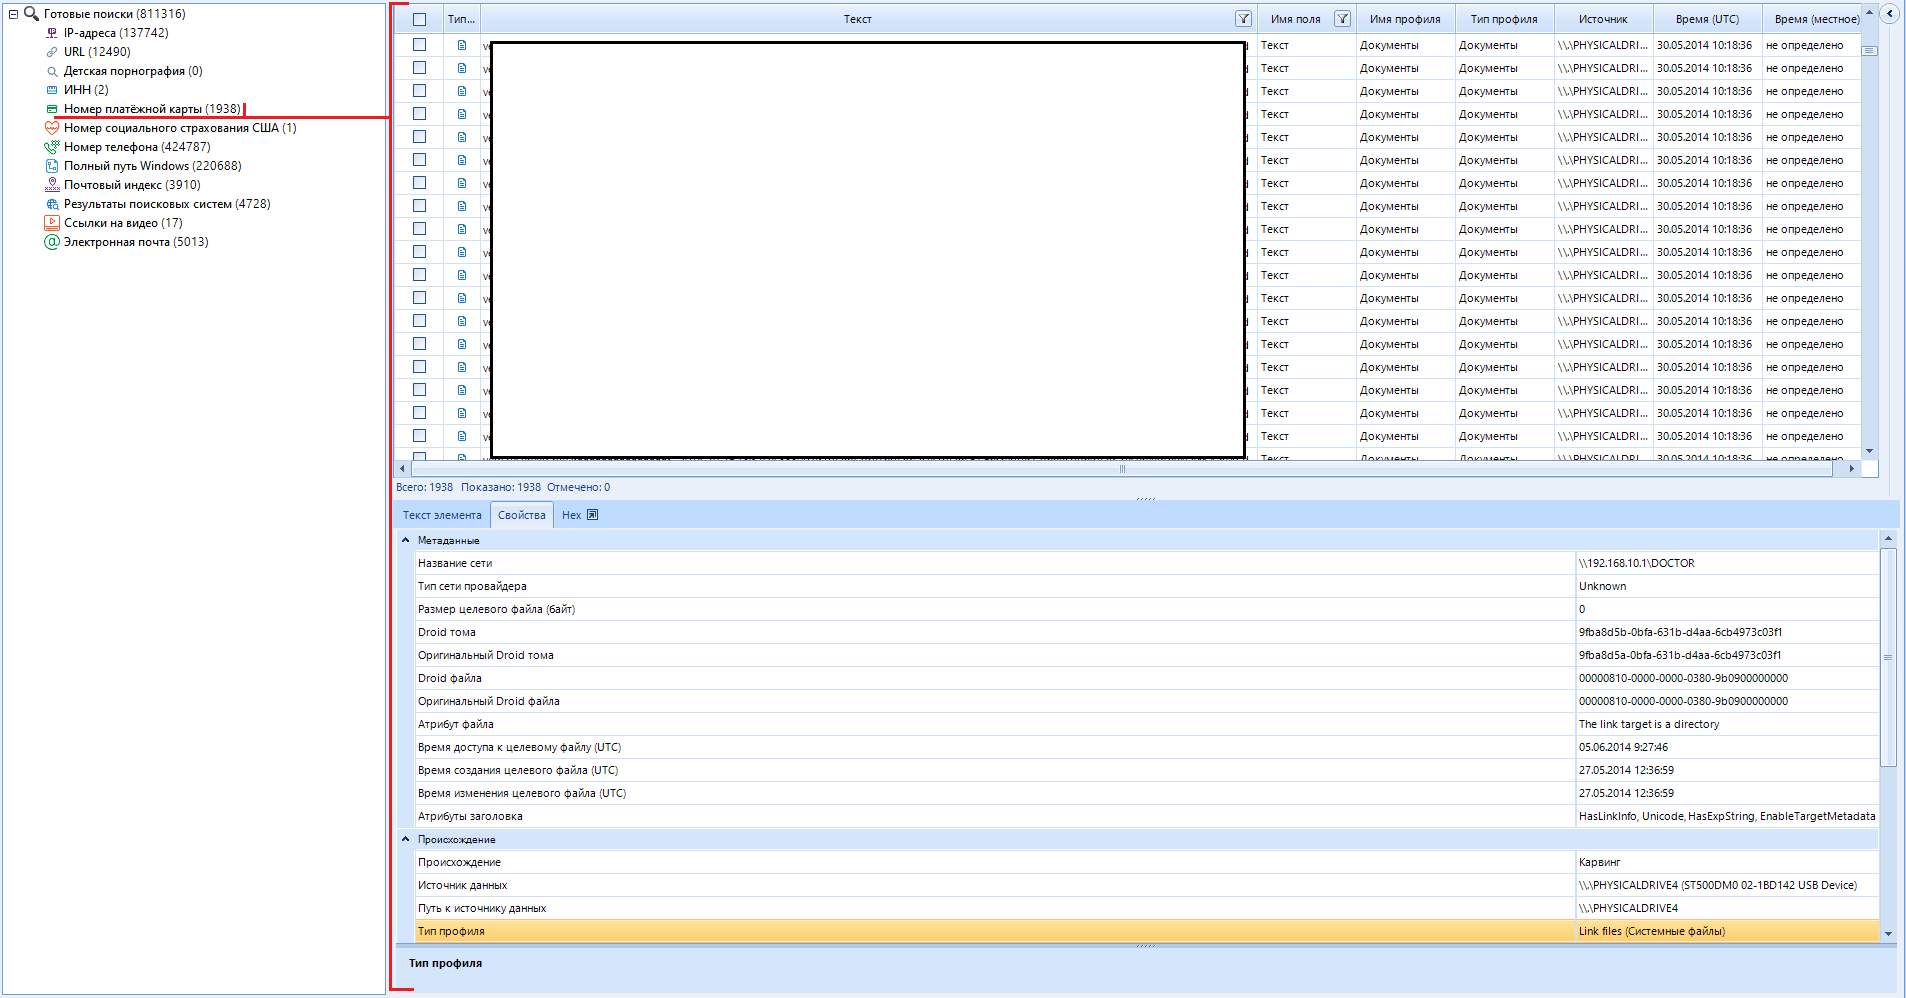
The main disadvantage of such a search for text data is mask search. The Evidence Center will treat any result that matches the search mask as valid, even if it is just a set of characters. It turns out that about 30% of all searches are garbage data. Most often, this happens with phone numbers and payment card numbers. In defense of the software, I want to note that such a result is better than its absence at all.
I talked about all the main functions and settings of the program, avoiding unnecessary information. Everything that I kept silent about, I considered unnecessary for the reader. I am sure that when faced with functions that we have not considered in this article, you will quickly find your way around having such a base like this one.
Belkasoft Evidence Center is one of my main tools, because, as I said, you can use it to get data not only from phones and computers, but also from cloud services .
Remembering one of my articles , I already talked about the possibility of monetizing hacked email accounts by parsing them into content. Evidence Center allows you to automate the collection of data from a cloud service for further study. This saves a huge amount of time and effort.
To start taking apart the mailbox into its components, we need to create a new case.
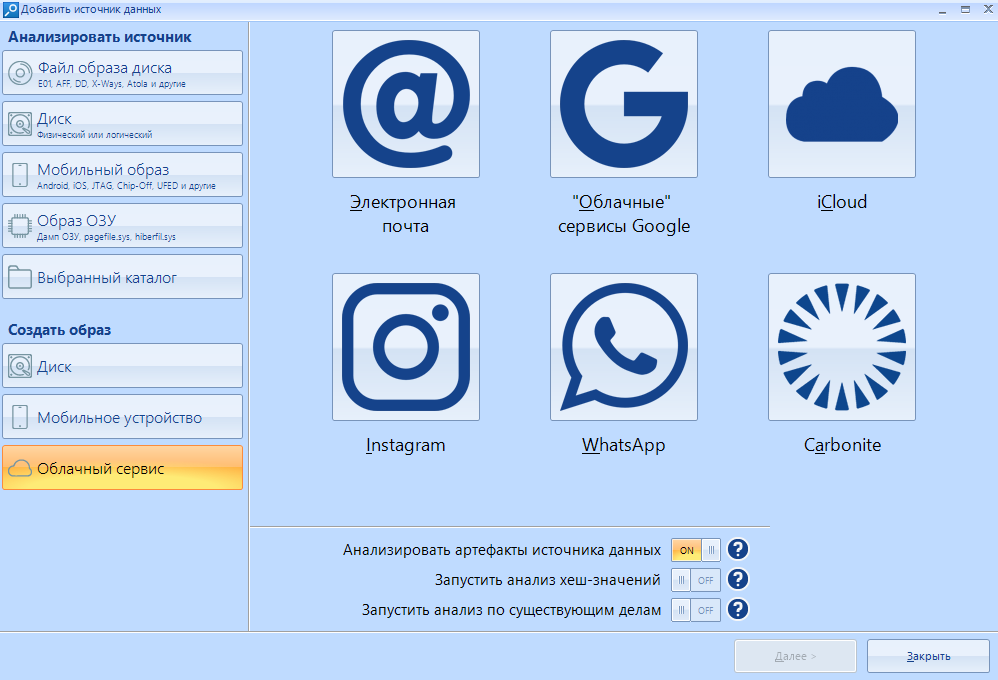
Having selected a cloud service as a data source, we can specify one of the supported parameters. In my case, this is “Email” . For those who are interested, the program cannot scan the VKontakte social network.
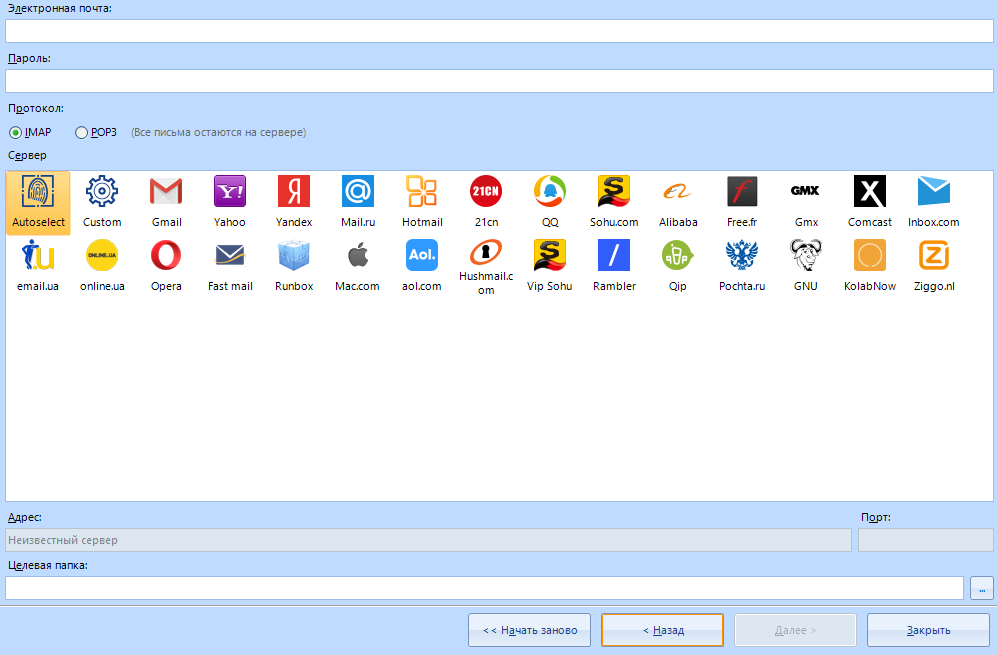
Let's analyze the lines:
First line - E-mail
Second line - Password for e-mail.
If we want to download all the data, we leave the protocol IMAP.
Using the POP3 protocol, we leave all emails on the server.
I will scan the mail of the mail ru service, so I choose this service from the list of existing ones. Address and port are filled in automatically
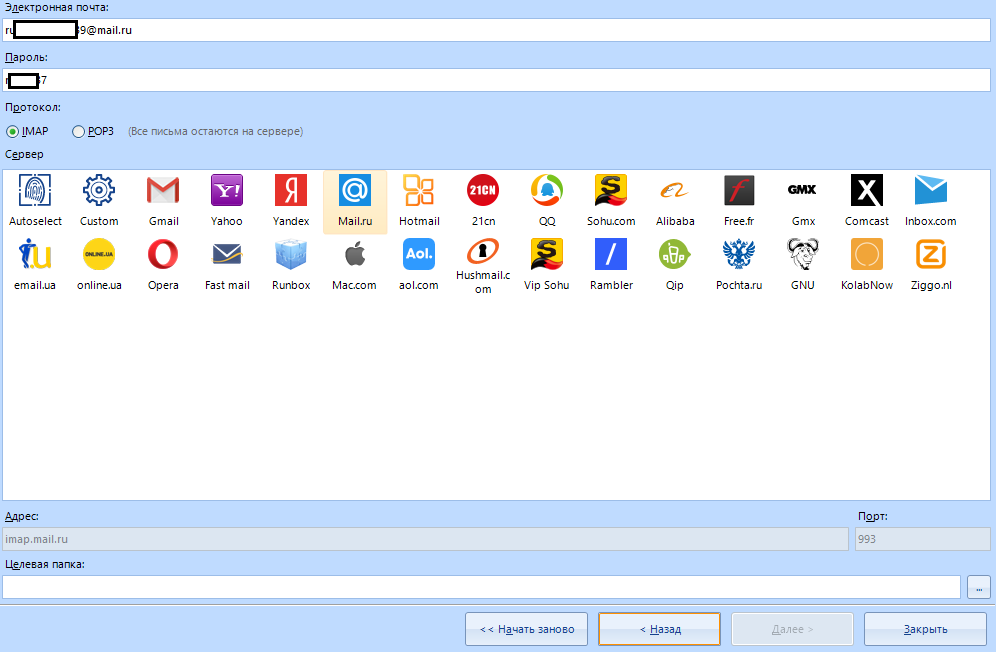
It remains to enter the target folder for downloading the information and click on the "next" button . You can watch the process in the program log:
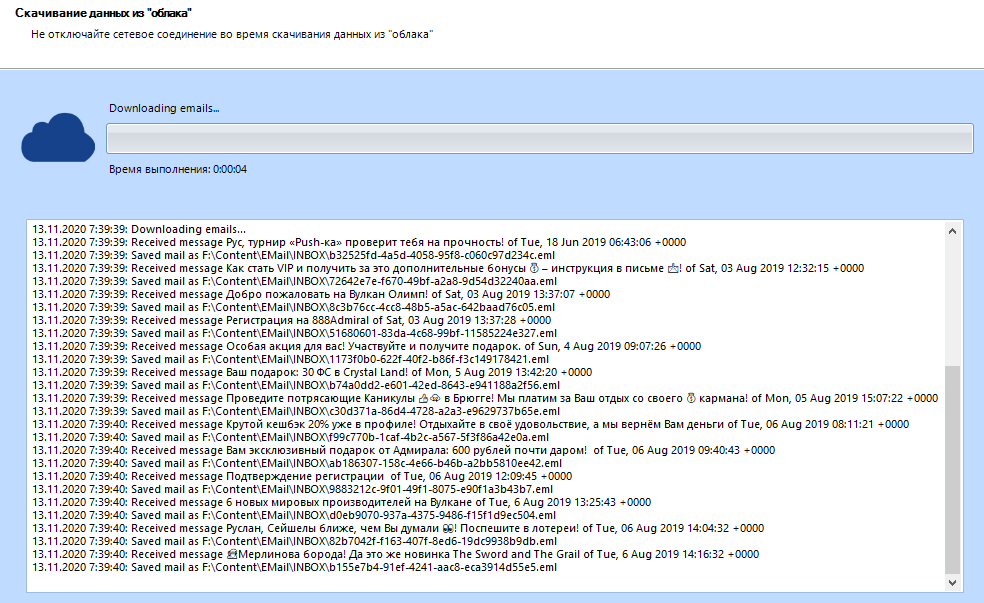
Well, isn't it a miracle? Imagine your emotion now:

Of course, this is just a test mailbox, there is no serious or interesting data there - just endless spam. But we are not looking for a treasure here, but we are testing the program. I chose this mail on purpose, since it is abandoned and completely filled with ads. A kind of stress test for the program.
So everything was exported successfully. Open the destination folder and see the result:
the .belkaml extension is usually a disk image, so we open it as a disk image file in a new case. We use the first item of the left menu:
Click on the "finish" button and ...
Voal. We have neatly sorted data.
If we rummaged in this box on our own, we would drown in the stream of endless advertising.
Thanks to this feature, you can parse hacked emails into content in just a couple of minutes. Moreover, you can collect content from several mail accounts at once, adding new data sources.
Working with them (Cloud services) does not take much time and resources, unlike working with other data sources, so you can scan a whole bunch of them at once.
Now let's talk about working with RAM, because I promised to return to this topic. We will consider a utility from the creators of Belkasoft Evidence Center. It is designed to create a RAM fingerprint.
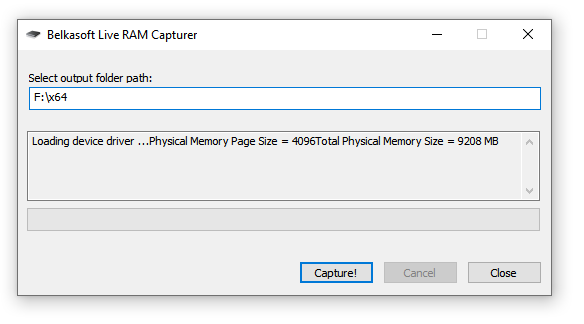
This program is called Belkasoft Live RAM Capturer and looks like this:
It is distributed completely free of charge.
You can download it from the official website at the link: https://belkasoft.com/ru/ram-capturer
I warn you: you have to fill out a small download form. Do not be alarmed, it can be clogged with left and non-existent data.
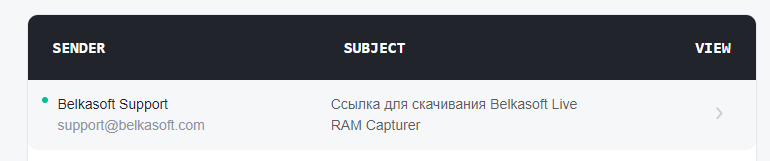
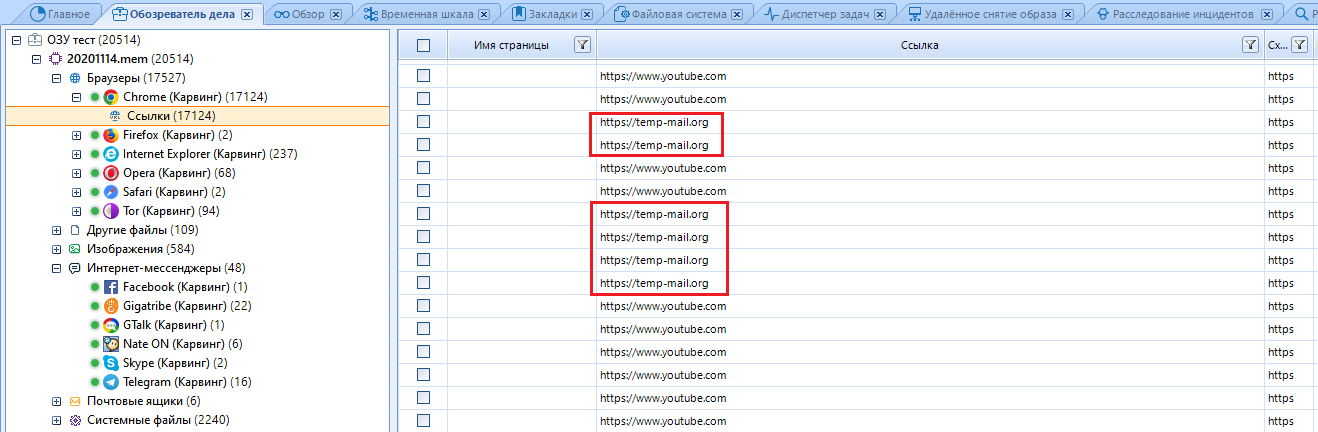
The download link should be sent to us by mail. To do this, you can use your mailbox, or temp-soap .
On the official website, select the product of interest to us (RAM Capturer) and enter the mail for feedback.
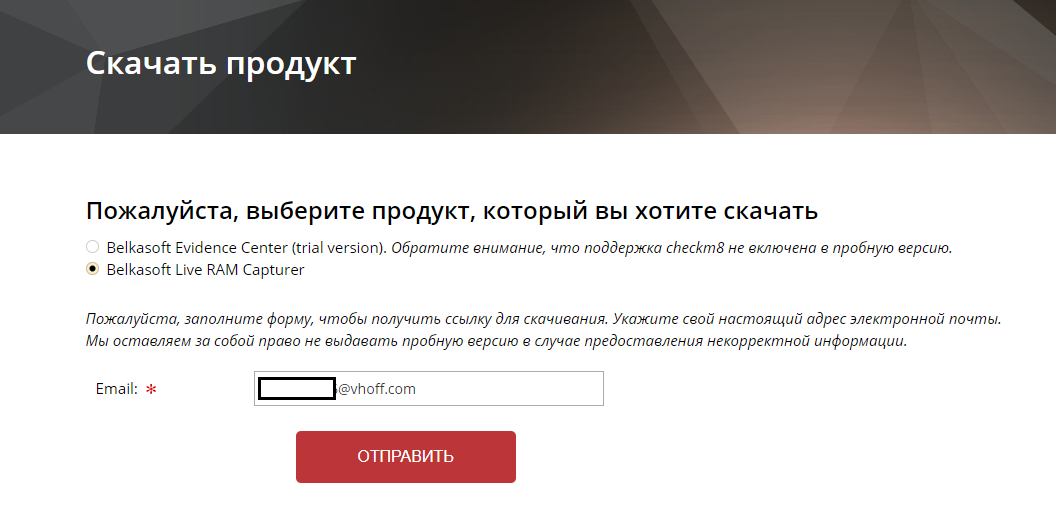
After clicking on the "send" button , we are transferred to that very unfortunate profile. Entering your data, as I said, is optional, so we fill the fields with all sorts of nonsense. By the way, in the incoming messages there is always the signature of the employee “Maria”, so you can say hello to her in the “Additional Information” window - make the person nice)
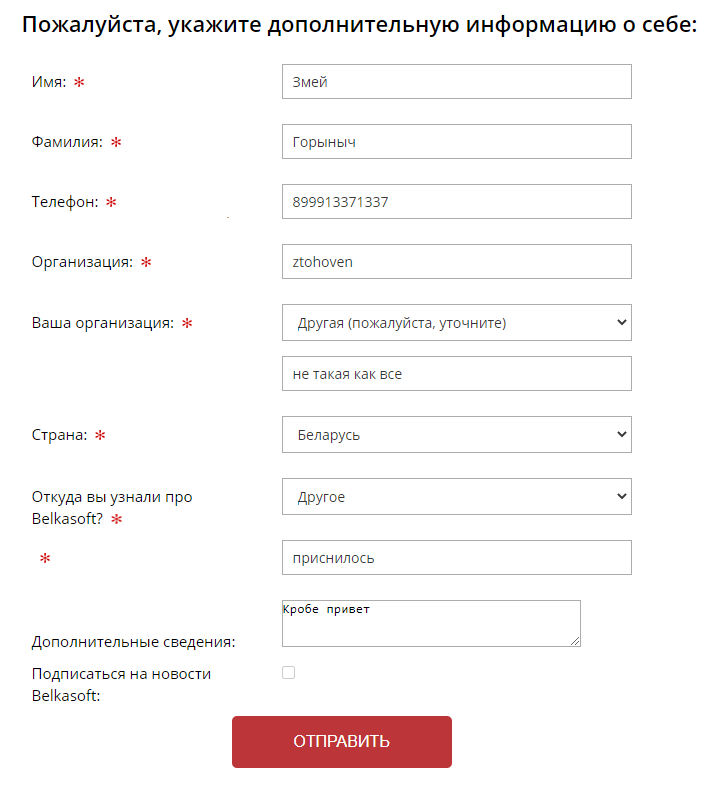
After filling in all the fields and sending the questionnaire, they scare us by considering the application, but the download link is sent instantly:
Download, unpack one of the versions (x64 or x86)
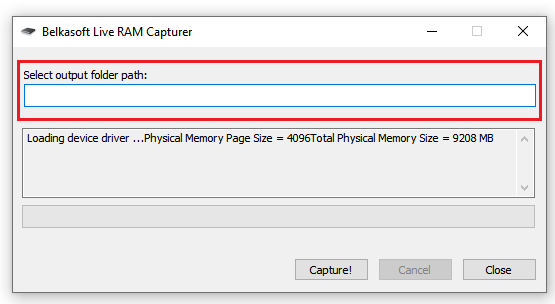
Here we enter the path along which the result will be saved.
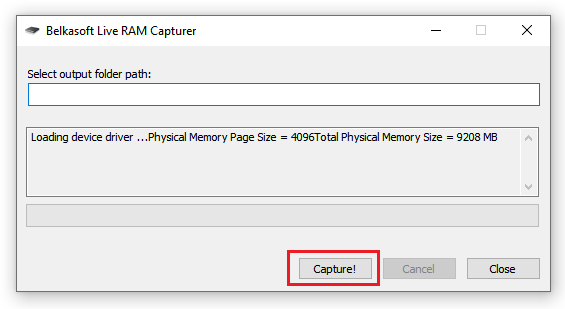
To the "Capture!" we click to create a “snapshot” (dump) of our RAM.
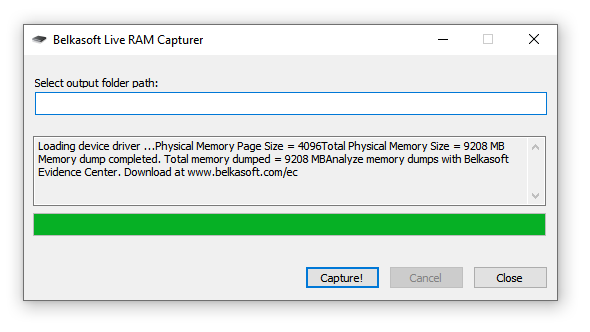
This is how the program terminates. We can close it and go to the folder where the result was saved:
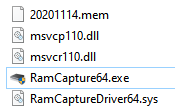 Our file is at the very top, with the extension .mem
We need an Evidence Center (or Reader) to read this file.
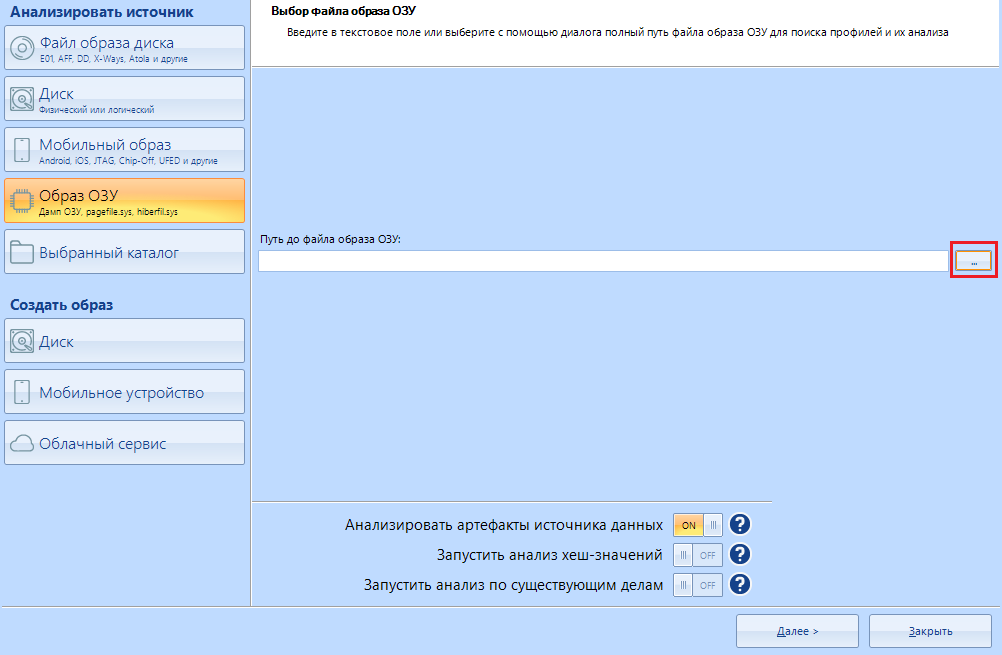
After creating a new case, we select "RAM Image" and look for our fresh (or not so) dump. Found it? Great, the Next button is for you
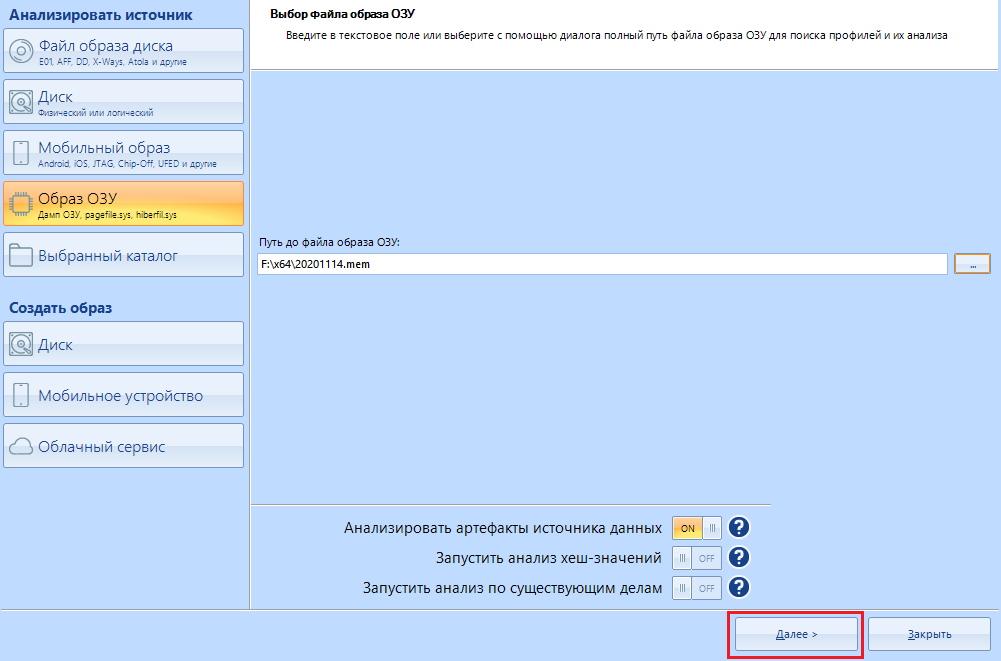
Please note that of all the methods for extracting data, only carving is available to us:
By configuring it, we can enable the very option “SquirrelCarving” . I will not enable it, because this function is very slow. In my case, even after an hour, the analysis of the structure did not move further than zero. You can take a chance and turn it on. But you will get more "long" files and some goodies on top.
Don't expect much from the “snapshot”. It can store passwords and other important data, but most of the data is corrupted.
The study of such data sources is carried out in order to find traces, and not get the data to enter your VKontakte. But I must inform you that passwords in RAM are also found.
Let's assume this situation. You are sitting at a computer, surfing the Internet, and then uncles in uniform burst into your home and started pawing your computer with serious faces, having previously twisted you and knocked you down on the floor. What will the operatives look for in your RAM? For example, the in-memory fingerprints of a hacker forum can be a strong piece of evidence against you if the charge is related to cyber crimes. In addition, the RAM may contain the IP address that your VPN service once used. And for some reason I am correct that this will be the same IP from which the attack was made. Of course, this is not the only thing they will look for there.
Unlike a hard disk, data is not stored in RAM for a long time, and is overwritten in the course of work. However, data in some areas during computer operation may remain intact throughout the entire operation. Moreover, if you have time to turn off the computer before they start working with it, there is still a chance to dig something on you from your own RAM.
The fact is that even after the computer is turned off, the data in the RAM remains intact for some time, and does not disappear instantly. Of course, they disappear quite quickly, but if you have time to turn the computer back on, or freeze the memory bar, the data is stored much longer.
I made a cast of my own memory, and by its example I will show what can be found there. I will not show everything in order to give free rein to your creative nature and start looking for dirt on yourself on a grand scale.
For example, I would be suspected, because my RAM has saved data on visiting temporary mail. As you remember, in hard drive searches, temporary mail was on a par with child pornography. This is also substantial evidence.
With the help of this tool, recent actions and interests of a person are clarified, which are already used in the future to create a complete picture of what is happening in your life.
In addition to simple data, links to files remain. As an example, I will show the description of one of the files found in the Hex values of one of the links. There is a link to a site with "hacker software" , which will be a significant reason to mess up its visitor.
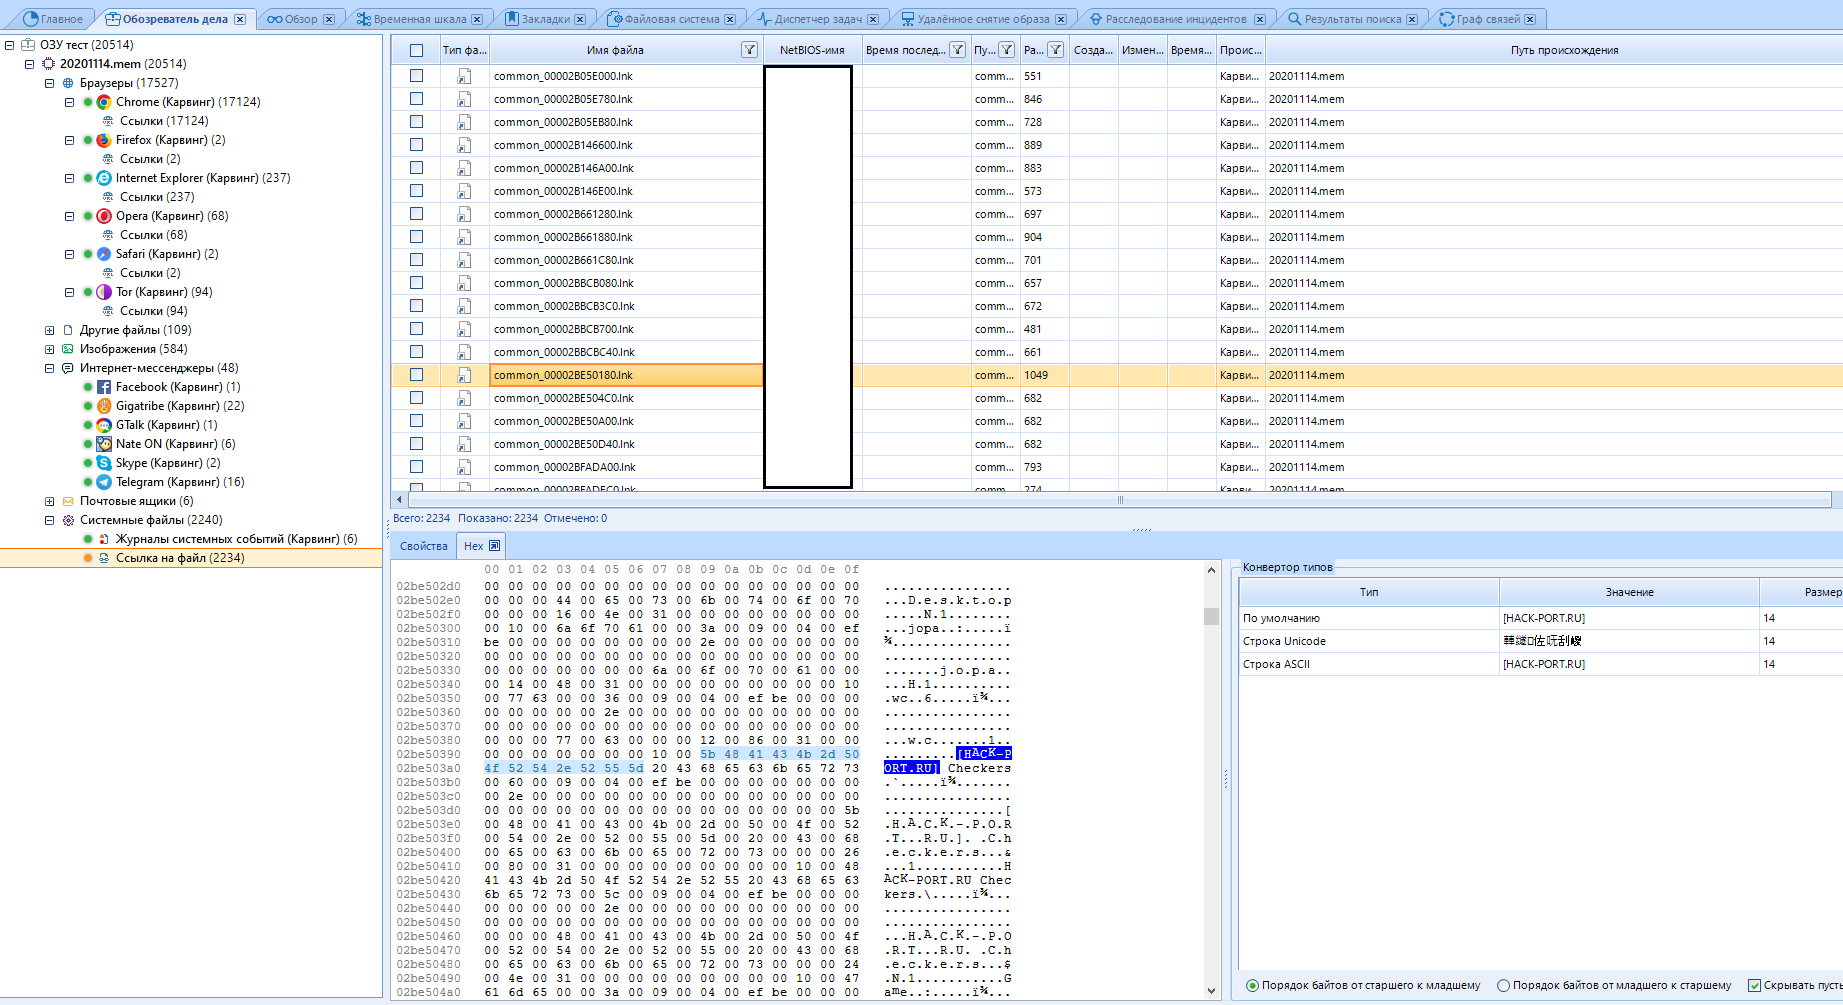
And this is all just one link to the file. Almost any file of a fingerprint or snapshot of a RAM, upon careful study, will tell you a lot of interesting information.
Universal advice: if you do not know what kind of file it is, open it in Hex and read it.
Studying a RAM dump (aka RAM) is actually no different from studying a hard disk (except for the absence of a file system), so I see no reason to consider the same functions that we considered earlier. The only thing I will say about is the direct difference between the "File system" item. When you activate the BelkaCarving item, the processes will be displayed there.
The last thing I would like to talk about is Belkasoft Evidence Reader.
This software is needed exclusively for reading reports. This is still the same Evidence Center, but stripped down. In it, only the functions of reading reports, searching by them, and so on are available:
You don't need to download anything to get this software. It is enough to open the main program, select Tools-> Export to Evidence reader . This program, sorry, just bulges out of the main one.
I told what to poke where to work. Why it should work, I kind of also explained. It turns out that the time has come to take stock.
Is the software usable?
Belkasoft Evidence Center is one hundred percent usable. The program has a huge number of uses, ranging from data recovery for unreadable disks for money, to dark stuff like leaking data from mailboxes for sale. How exactly to use the program is up to you.
Really ours?
The St. Petersburg company Belkasoft LLC was founded in 2010, yes. I must say that even pride takes it that domestic products can be of high quality. Naturally, Belkasoft are not the only such good fellows, so far not everything is so bad with us.
I hope for the further development of the company.
Is it worth learning to work with this program further?
Yes. Worth it. This is one of the most powerful information management software I've ever seen. At the very least, you will learn a couple of new words. I hope I was able to interest you in this article for further study.
A word from the author
It took me a month of working with the program to write this article, more than 40 studied different media, I read many articles on the topic and studied all the documentation. This is my most laborious and time-consuming work, therefore I sincerely hope that the article was useful, I have not messed up anywhere and the work has not been wasted. If the reader likes this article, there will be a whole series of similar articles devoted to the topic of forensics.
If I was wrong somewhere, I apologize in advance. You can correct me by writing about the error. Live and learn.
Thank you for your attention.
See you in the next article!
(c) cybersec.org
Hello dear reader!
As you understand, in this article we will get acquainted with such a thing as forensics. Yes, most likely you have already heard about it, or even know what it is. But if you don’t know or have forgotten, I will remind you.
In short, forensics is called computer forensics. This is nothing more than a whole applied science of solving cyber crimes, searching for digital evidence and evidence. The topic is very interesting and deep, so in this article I will not go deep in order to avoid overloading the reader with unnecessary information.
Today we have on our agenda an extremely interesting program, which turned out to be quite a difficult task for me to get. What kind of software is so mysterious? It is called the Evidence Center.
It is the flagship product of the Russian company Belkasoft, which describes its creation as “a comprehensive digital forensics solution for removing data from devices, searching, recovering and analyzing digital evidence stored in computers and mobile devices, as well as cloud services. Evidence center facilitates the acquisition, search, analysis, storage and transmission of digital evidence located inside computers and mobile devices. The program will quickly extract digital evidence from a variety of sources by analyzing hard drives, images, cloud applications, working memory contents, iOS, Blackberry and Android backups, UFEDs, JTAGs, and chip-off dumps. ”I will translate into human language: this software is designed for computer forensics, with the help of it they scan and analyze various storage media, from a hard drive to a telephone.
At first it was a small, primitive program for performing the simplest analysis of media, but later its creators significantly expanded the development team, and their brainchild ( Evidence Center ) became much more powerful. How much? Of course, I will not conduct research and comparison of versions, but I will definitely tell you about the possibilities.
Before we start working with the software - a few words about the hardware that I use in my work and advice for novice detectives.
We will work, as you understand, with information storage devices. Specifically in this article - with hard drives. So I connect them not directly to the board, but through a separate device. Because this method is much easier, because constant visits to the computer case are not needed.
Personally, I use such a thing as the ACE AgeStar docking station (3UBT2) . It costs one and a half thousand rubles (Currently 1650). It is a fairly compact and convenient device, the data transfer rate of which reaches 5 Gb / s (500 Mb / s - USB 3.0) and is powered by a 12 volt adapter.
This miracle looks like this:
On the back and with a disc:
In working order
Of course, there are very small ones, you can buy them on aliexpress for only $ 3-7. But, as it seems to me, it is better to take a branded one than one made in the basement by a Chinese noun-name.
For those who do not know, a “Docking station” is a stationary device with connectors for connecting electronic devices to the main one. They (Docking Stations) are used to quickly connect multiple devices to power and data traffic cables at the same time.
In short, docking stations allow you to simultaneously charge the device and synchronize information: we power the hard drive and simultaneously read information from it.
If you don't have the money or the opportunity, don't worry. This station is needed solely for the convenience of working with media. You can easily connect a disk or other media directly (Of course, if connect \ read \ work are supported). There will be only one difference from working through the docking station - the convenience and the buzzing of the disc under the ear (in fact, not only, but this is a completely different topic that is not yet interesting to us).
From the tips for work, I can say the following:
- Do not touch the media you are working with during scanning.
I think there is no need to explain why. - Evidence Center without tuning (or with tuning for maximum performance) consumes a lot of resources, which is not surprising. In this case, any action "on the side" can disrupt or slow down the work of the program, or even hang it altogether. I strongly advise you not to study the program without first setting it up while working with the carrier.
- Even a customized program can freeze your system.
This most often happens if you work with disks whose volume is less than one terabyte. At this moment, do not touch anything, wait for the moment when everything is normalized, otherwise there is a chance to completely hang everything: both the program and the system.
Typically, the waiting time is no more than one minute.
After extracting the files from the archive, the first thing we need to do is install the software itself. The installation file is named “ becu.cm.all.x64.exe “:
After starting the file, we are waiting for the installation graphical interface to appear.
The program has been translated into eleven different languages, so
After clicking on the " OK " button, we move on to the next stage, where we are unexpectedly advised to close all running applications. In fact, this is not necessary, we do not need a reboot. At least in my case, everything happens that way. If in doubt, follow the instructions, leaving only the necessary applications for further work. Click "Next":
We accept the license agreement without reading it, and proceed to select the folder for installing the software. If you suddenly a
I advise you not to change the path to the folder and leave it at the default “ C: \ Program Files \ Belkasoft Evidence Center x64“:
Whether or not to create a folder in the start menu is up to you:
We are waiting for the program to be installed on the hard disk:
After successful installation, be sure to remove the checkbox from the program launch point. We shouldn't run this thing until we grunt:
Done. We installed the software and now we are starting to crack it. To do this, go to the "Files" folder . First, we use “ Spoon Studio Extractor.exe “, which is exactly what the antivirus swears at:
Run it as administrator:
Here we need to enter the path to the Evidence Center App.exe file and extract all files by clicking on the “Extract Files” button . While extracting (or reading) files, the computer may collapse, but you should not be afraid - this is the norm. At the end of the work, the program log will contain a list of extracted files and folders:
When finished, the program will create a folder named “Export Files” next to it. All extracted files will be collected there. Next We will work with this folder using the “BelkasoftFixer.exe” utility . Copy the utility to the newly created folder and run it already there
All files will be moved to the “@ PROFILECOMMON @” folder . The work will be done in a matter of seconds. Usually this is evidenced by the inscription "Islem tamamland?" (in Turkish “Process complete ”).
Who is interested in translation.
After that we move all files from the folder “@ PROFILECOMMON @” directly to the main folder of the program:
When asked about replacing files with similar names, we answer positively:
All that remains is to replace the main program files with those prepared in advance. To do this, go to the “Cracked” folder and move all its contents to the program folder with a replacement:
From now on, we will run the program exclusively through the file “Evidence Center.exe”
We do not touch “Evidence Center App.exe”. You can delete it altogether, but I don't delete it because I'm too lazy.
Are we launching? Let's start!
The first thing we see is a splash screen, where all its capabilities are written out.
After the splash screen, we are greeted by the Evidence Center's main menu:
Before proceeding with a detailed analysis, I advise you to remember my article on Netsparker . Or rather, her meticulousness. This is, consider, a disclaimer for the main part, so that you get ready.
Well, reader, have you tensed?
Relax, we will only cover the basic functions.
So.
The entire program can be divided into three conditional parts:
Now a few details about each item.
- Cap
This is where the main functions of the program are located, such as saving a process, searching by results, creating a report, etc. - Functions
Selection of the main functions of the open menu. Their set depends on which menu we are currently in. For example, in “Main” there are only three functions: settings, opening an existing case and creating a new one. In addition, there is access to recent scans carried out through this program on this computer / media, but this item will appear only if there are similar ones. - Function control panel
Or a view pane. Depends on the open menu, function and your mood.
The first button is to create a new case.
By default, when the program starts, it is already pressed.
Pay attention to what is in the right menu:
The text "case name" is set by default to the date and time of its creation. If you want, you can turn on your fantasy and write something of your own.
Root folder - the folder where the media scan report will be saved. You can either enter the full path to the destination folder manually, or select it in the explorer using the special button to the right of the input field:
The field "Case folder" is in the inactive status "ridonli". This means that we cannot change this line. Here is the full path to our new case, which was generated from the first two points.
The highlighted line “Created by” indicates the name (or alias) of the person under whose supervision the scan was performed. By default, there is the name of your computer.
The “Time Zone” is indicated for easy reading of the scan information. I always indicate the standard belt "+03: 00", which I advise you to do too. You can ask your own if you wish.
A huge text field called “Description”, unlike other items, is optional. This is just a note to the case being created. You can leave this field blank.
The “Create and open” button is used to create a new case and go to the choice of media for work. We'll come back to it later.
Move on to the next button on the left.
If you already have a "case" (disk scan report), then open it, obviously, by clicking the "Open from disk" button
Here you can open an existing case by entering the full path to it. Otherwise, you can open it in the explorer by clicking on the button
The case does not open automatically, so you have to use the "Open case" button
The last in line is “Settings”.
If something does not suit you in the operation of the program (for example, the amount of resources consumed), or you need to change one or another parameter, this item is intended for just such situations. Before starting work, I advise you to configure the program.
Perhaps this is the most interesting and basic point that I will curse while writing this article. We will not bypass it and set up the program.
After clicking on the button, a whole book of eight tabs opens:
We will study all of them (tabs) thoroughly.
Got netsparker flashbacks? Great, let's continue.
The first tab is “general”.
These are general program settings.
The item “Path to the application folder” is used by the program to store its parameters. In most cases, you can just leave this option as default, but if you are going to store settings and options on a flash drive, moving from one machine to another, this function will help you out.
In short, we leave it as it is, because we will not run anywhere.
The next item "Path to temporary folder" is needed if you do not have so much space on the main disk. During the analysis, the program processes a large amount of information: it unpacks and extracts various files, taking up a lot of space. The temporary folder is used to store these same files.
As an option - you can use the hard drive used for ng bigger size as a temporary folder. The main thing is that this disk is not scannable.
By the way, with the “clear folder” button you can wipe the software's tempo files.
Next we have “Maximum number of CPU cores used”.
With this parameter, we indicate how many resources the program should consume. You can choose from two cores up to the maximum number of cores installed on your machine.
Why two? And here it is interesting.
The Evidence Center reserves one core for the user interface. Also, if you have a powerful machine with a whole bunch of processors (there are such, google), then in this case the hard disk will suffer, therefore the creators of this program recommend reducing the number of used cores to half.
I have eight cores, I indicate 6.
Item "Size of cache memory for indexing (GB)".
The program uses the sophisticated ElasticSearch mechanism (For dummies, this is a big data search engine (also known as “Big Data”), an analytical NoSQL DBMS that has a huge set of search functions), which obviously requires a lot of memory.
If you have a small amount of memory, we configure this program to use a smaller amount, otherwise there will be errors.
“Always open the last case” - when the program starts, your last case will be opened.
“Record search folders” - in my heart I don’t know what it is, honestly. The creators say this is for debugging purposes.
In short, we pass by, there is nothing interesting here.
“Ask if I want to add another data source” .
When you select a medium, the program will prompt you to select an additional one in order to scan several at once. It can be convenient if you have a lot of work. We can leave this item on. If anything - it can be disabled after the first request to add an additional data source.
The item "Request confirmation of cancellation of all tasks" is needed only if you are afraid of accidentally stopping scanning. If the item is active, when canceling scanning tasks, the program will ask if you really want it or if you were just joking.
The item “Show notification 'Save and exit'” exists for the same paranoid who are afraid to accidentally end the scanning process. Before closing, the program will offer to save the result, thereby preventing accidental closing.
The next page is next. "Language"
These functions are needed solely to customize the appearance, they do not have any effect on the operation of the program. But I will consider this point as well.
In the “Language” item , you can select the program language with which it is convenient for you to work.
“Date Format” allows you to change the recording format and date display. In the United States, for example, the recording format is not day: month: year, but month: day: year, so if you are an American, you can customize this item for yourself. In addition, the setting allows you to select a separator between time intervals: starting from a point, ending with a hyphen.
“Time format” is the same as with the previous item, but we customize the time display.
“Default encoding ” - setting the encoding of the displayed text data. I advise you to leave it as it is and not touch it.
Now the tab (or page, whichever is more convenient) "Images"
Here you will be setting up work with images found on the media.
"Definition of pornography" allows you to blur all frames or everything except faces if you are a particularly shy person
The default “OCR Language” is English. To install another - you will need to download the language pack, but for this you need to contact support. In this article, I am your support, so stay there, we have not even come to the middle of the article, and some, I see, are already tired
I have combined "Face / Pornography Mode" into one item because of the identical work and settings, as well as because I can afford it. There are only three settings: Fewer false positives , average or more . This means that the program is ready to cover up any photos and pictures where there is a hint of pornography or to identify faces even where there are theoretically none. Come on, make a schizophrenic out of the program.
"Skip small images" - the program will skip all images, the size of which is less than the minimum specified, so as not to waste time on a knowingly useless resource.
That's all with that. Turning the page to "Video"
As you can tell by the name, this is the setting for working with found video files
“Frames per second” is used to extract keyframes from a video. Here we indicate how many frames per second the program will process. This function can be described for a long time: how the program processes frames, and how it searches for a key one. Let me put it simply. The settings of this function suit us, we leave it as it is.
“Frame similarity” indicates how different two frames must be to say that they are both key, in how. In short, do not hesitate, leave it as it is.
"Extract keyframes automatically" - only necessary if you work a lot with video,
Moving on to the “Carving” tab, we get to the end of the settings overview. By the way, the second half is more difficult than the first.
Do you think that if there are only a couple of buttons in this tab, then there will be little text? You are wrong. Here we will set up signatures for carving.
" Carving " is an algorithm for data recovery. It is based on file signature search, or signature search. Usually, when restoring, they work exclusively with the data saved in the file system. In the same case, the algorithm processes the entire data array by reading the entire surface of the hard disk. Here we indicate where the file we need begins and how it ends, so that the program knocks out exactly what we need from the data monolith.
Unfortunately, as cool as this algorithm is, the results may be incomplete. In addition, false positives are possible.
For example, we set the initial bytes for the search in the settings and start carving. Work begins and at some point the program stumbles upon a txt file, in the text of which the initial bytes we specified earlier are found. Then the file will be incorrectly identified and a false result will be given.
Such mistakes are frequent guests. You can observe them yourself when you start examining the recovered correspondence data. BEC (Belkasoft Evidence Center) collects such errors there. You can recognize this by hieroglyphs instead of text and / or username, a strange set of numbers and the absence of a username. Do not be afraid, because as Malysheva says - “This is the norm”. The main thing is that this does not affect the final result.
Let's pay attention to the work area.
Using the buttons at the bottom of the window, we can import signature sets, add new ones (we will dwell on this point in more detail) or edit existing signatures for search. For those who do not understand - here we set the data by which the search will be performed.
By clicking on the "Add" button, we open a new window where we will indicate the necessary data.
The field with the name “Name” is optional. Think of it as just the name of the search setting you are adding.
"Initial bytes" - data in the form of a hexadecimal string, from which the data we need begins.
"Trailing bytes" are optional data, but if you know them, you can specify them in this field. Everything is the same in hexadecimal form.
In the line “extension” we enter the extension into which the program will save the cut piece of data, for example, .PNG
“Artifact type” is a hint for the program what kind of data we are looking for and where to show the cut result. By default, those recovered using this method are labeled “other files”.
Here is an example of a ready-made carving settings item. You can leave out everything that I wrote above. This is for general development.
We can go to the page "VirusTotal"
There is only one field where you need to enter the API key to work with the VirusTotal service. Thanks to this feature, all .exe files will be scanned for viruses. It's nice that there are instructions on how to get the key right in this tab. Everything for people, thanks to the developers.
Penultimate page. Hash values.
You know what a hash is, right? No, it's not me. Can you distinguish MD5 from SHA256? Excellent. This item allows you to find specific files using a predefined set of hashes.
"Hashing Algorithm" . Here you can specify which hashing algorithms to use when calculating file hashes. The fourth and last option, PhotoDNA , deserves special attention . This is a function to compute the hash value exclusively from media files (images, video and audio files). It is quite rare, but it continues to be used.
"Analysis settings" .
In this menu, you can set file size limits for calculating hashes, which can improve performance. For example, what's the point in calculating the hash of a 200GB file?
"Bases of hash values" - add , delete or import a list of hashes for searching using the buttons in the lower right corner.
After clicking on the "Add" button , the following window opens:
Let's study it too.
The string "Path" is the path to the file with values. Yes, you won't be able to add it by the piece.
Warning: Only the NSRL (National Software Reference Library) dataset is allowed . Who does not know - this is a huge repository of known and proven software. For example, you can load data about system libraries and immediately mark them as “white” (safe) files.
Yes, this is the identification of files by hash value
"Label". Consider it just a name that will be assigned to the found files by hashes. For example, we can name this shortcut “System” if we downloaded data about them.
The color with which the results will be marked.
By the way, we will choose from here:
"Type".
Thanks to this setting, we can choose which list the results will belong to: a whitelist or a blacklist .
Here is an example of the data loaded. But, as you understand, we do not need it yet, we skip it.
The finish line of the settings, go to the last tab “Network”
Yes, the program supports remote data collection.
This is the server setup for remote scanning. LAN is also supported. I don’t think it’s necessary to explain how they differ. As you understand, the server will be the computer from which the scan will be carried out.
We configure this item. We will need this later.
Setting named “Server IP Address”.
Here we indicate the IP address of your computer on the network. If you are on the same local network, this might be your local IP. Well, or external. Depends on the occasion and purpose.
Where to get your IP from?
Win + r -> CMD-> IPconfig, IPv4 address.
I must warn you that the mask does not work very well, and you will have to write empty spaces with zeros.
For example, I am using LAN scan and my IP on the network is 92.168.1.6. In the setting, I enter 192.168.001.006
"Server port". In addition to the IP address, here you can specify the port that will be used for remote work. By default, I use port 33632.
"Use SSL - certificate". You can encrypt communications between the remote and local computers using an SSL certificate. Cool, yeah?
"SSL Certificate File". Here we specify the path or select the SSL certificate file
"Password". The password for the previously specified SSL certificate.
“Set download start time”. Like a timer bomb. Set the download start time and wait.
To save the settings - click on the "Apply" button at the very bottom:
We're done with the settings!
We will consider the rest of the functions during the main work.
In order to get started, select the “New Business” function in the “Main” menu (exactly as we discussed earlier).
What's here but how do you know, so fill in the fields and click “Create and open”. We are waiting for the program to finish its calculations, and we begin to study the following window with a bunch of buttons and pictures:
According to the old tradition, we can divide it into two parts: left and right.
In the left work area, we select the source of the analyzed information:
And on the right, select the device or perform the necessary manipulations with the settings:
Let's explore all the possible options.
Let's start with the disk image files, the first item on the left:
The program supports a huge number of extensions (7z, zip and tar archives are also supported). Just look at the amount! For every taste and color. No, I will not show you, see for yourself.
Disk.
This is the main menu. All connected disks will be visible here, even if Explorer does not recognize them (This is usually due to a file system different from the one recognized by the operating system, for example, I can cite APFS, Apple's file system. Physically, the disk will be accessible, but it will not be logically recognized. However, as I said at the very beginning, the Evidence Center works with this system as well). Now I have a 1.8 terabyte disk inserted into my system. You can observe it both in the physical and in the logical selection menu. We will return to this a little later.
Mobile image
In addition to scanning disk images, Evidence Center can work with images of mobile devices. We will not work with them in this article. All for the same reason - I want to save this topic for a separate article.
RAM image
As with any other storage device, you can also take an image from the RAM. Belkasoft, for example, have released their utility for removing an image of RAM. We will consider this point later, but closer to the end.
Selected directory
Using this item, you can specify the program as a scanning point not the entire disk, but only its separate directory. It is convenient when you are scanning not a separate disk, but one of the workers.
Go to the sub-item "Create an image"
Here you can create an image of various devices for subsequent scanning.
The first button is "Disk"
Here it is possible to make an image of the disc of our choice. We make the choice of the necessary in the right menu.
I hear the question "how next?" I’ll help you now.
After selecting the media, you see the following menu:
This is the disk imaging setup menu.
This is the location of the image . To choose where to save - click on this button:
Everything is simple here. We select the destination folder for saving and the name of the future file.
Evidence Center supports imaging in two different formats: RAW and E01.
If you do not go further, then:
E01 - compressed format
RAW - uncompressed format
In my work, I always use a compressed image format, that is, the E01 format
" Checksum " can not touch. This is necessary to check the integrity of the files after creating the image.
In addition, we can split our image into parts in this menu:
That's all with this item. You are great, to create the image you need to click on the "next" button.
Mobile device.
In this menu, you can select the device from which we will create the image. To make an image of a mobile device, you need to change the USB mode on the phone.
As you may have noticed, Evidence Center supports Apple's platform. Moreover, there is a built-in Checkm8 jailbreak . But, again, this is a topic for a separate article.
And now the juice itself. Cloud service
Using this item, you can make an image of not just a storage medium, but one of the services. For example, you can scan your
We will evaluate the work of this item, we are still closer to the end of the article. I'm sure you will like it.
And now let's get down to the main work with the information carrier. In addition, we will analyze the remaining functions.
As I said earlier, the right menu for working with disks is divided into two items - Physical disk and logical .
In case the disk is divided into two logical partitions, you can select the one we are interested in. By selecting one logical drive, we can select the second later as an additional one. In order not to do this, select a physical disk, then all logical ones will be scanned as one.
We click on the disk we need, wait for the end of the signature analysis.
The window for setting the data types for search opens.
I advise you to always select only these items, but you can leave all items activated (as they are)
I will not explain what is what. I don’t think you have forgotten what “videos” or “Files” are.
Let's take a closer look at the scan and carving settings for the selected disk:
Let 's analyze the "Analyze" setting . To do this, click on the line "additional"
The analysis will go through the file system of the data source, scanning each logical drive, folder (including system, hidden and special), while looking for data of interest within each existing file. This type of analysis is quite fast, but it has limitations.
In this window, you can select the sections of interest to us. This is especially useful when working with dumps of mobile phones, because you can find a whole bunch of such sections there, but only a couple of such sections will contain important data. In addition, the "Recycle Bin Reconstruction" option will help you find files deleted using the Recycle Bin.
By the way, snapshots are not analyzed by default, since their analysis is an extremely time consuming process and this is not always justified by the result.
Now let's consider setting up the carving of the selected data source. The setting opens in the same way - by pressing the line "Advanced" under the item "Carve"
This window offers us a little more options than the scan settings window.
Here we can choose carving for marked, unmarked, or both . We can also choose whether to carve all the data, or "only free space".
Carving "the marked area" identifies the renamed files, the data is in an inactive space and a bunch of other buns. True, this is very time consuming.
Item "Enable BelkaCarving" is only available for memory dump and uses their proprietary BelkaCarving technology, which allows you to defragment the contents of RAM. Great for carving RAM to databases. In addition, the processes will be extracted and presented in a file system window, which we will examine a little later.
Click on “complete” .
When asked about adding an additional data source, we answer negatively (or positively, if you scan multiple sources):
After this message, the Evidence Center starts its work. If you have configured the consumption of computer resources, you can study the program while it is running.
Before we start exploring the main menus, we will examine the header and all its functions.
"File"
It combines several functions: opening another business, creating a new one, exit.
There are hotkeys (hotkeys):
Alt + F4 - Exit the application
Ctrl + O - Open another case
"Edit"
It includes editing the found data: Analysis, deletion, adding a new data source, searching by results, creating a report.
Hotkeys:
Ctrl + Shift + F - Add data source
Ctrl + F - Search
"View"
Changing the graphical interface. Adding new windows for working with data (let's look at everything), changing the theme, rolling back to the default view (restarting the program is required).
For some reason, the developers have built in hotkeys and here:
Ctrl + Shift + Alt + T - change the application theme.
In general, there are 9 themes of the application, and all of them (except two) look terrible. It is unclear why it was added at all.
"Tools"
Basic tools for working with scanning. Customization, export to Evidence Reader (we will consider it) and LACE , Creation of a dictionary of keywords for search, creation of images.
There are no hotkeys and their combinations.
"Help"
Local help for the program, License information, Search for updates (I do not advise you to poke here), Product information.
No hotkeys
Go to the quick access panel.
This icon is the creation of a new case. Like a button in the "Main" menu, but duplicated in the panel
Opening an existing case on a carrier.
Export to Evidence Reader
This function requires completion of all active media scanning processes, so it is best to do this at the end of the scan.
Deleting a profile, only works with optional data. For example, you can delete junk profiles in the case explorer (we'll get to know that later) to make the report a little cleaner.
Adding a new data source to the case. I remind you about the key combination the Ctrl + the Shift + the F.
analysis of the selected profile or data.
Search for data on a report / case.
When you click on it (or the key combination Ctrl + F), a window pops up:
Here we choose what type of data to search for: Word , with lovo from a specific file , Regular expression, or a choice of already preset search settings. The list of “ready-made searches” includes the following items:
I don’t think that these settings will be useful to you in everyday life. They are designed to search for prohibited materials and are mainly used by the special services.
But if you want, you can think of something like “Find CP on your PC challenge”
In the left menu, we select the data source that will be searched for. You can select several at once:
And in the types for search, we select the data by which the search will be performed:
Upon completion of the configuration, click on the "OK" button and a new search task is added to the program's work, which will scan files for the presence of specified data in the course of the main work.
That's it, the next item is "Create a report"
With this function, you can create a report for the selected area. For example, a report on browser cache, running tasks or scheduled tasks.
The window for creating a report looks like this:
The report can be created in one of 10 formats.
By clicking on the "advanced" button, we will customize the report on three main points: Formatting, style and grouping.
In formatting, we can choose the encoding (not always), sort the items (By early or late, no sorting or custom), set the header and footer (none), select the orientation (by default, it is landscape), and enter the name of the person by whom the report was created.
In the style, we set the logo. You can set your own, or you can use the standard one . In addition, it is possible to choose the font that is optimal for us, its size and color (report drawn up by Сomic Sans mmm oaoa).
In the grouping, we customize the generated file. We can split it into several files, but according to the standard, reports are generated in one file. In addition, you can group items. They are not grouped by default.
After setting, we can click on the “Apply” button (I will not highlight it) if you have configured or “Cancel” (I will not highlight this button either) if you just came in to look or feel that you messed up.
The report itself looks like this:
With the report everything, let's move on.
But I don’t know what it is. True, I even read the help twice.
"Help"
Opens local help. Caution English!
If you have any questions about this or that item, but I did not consider them in this article, please contact
With this sorted out. It remains to deal with the windows
We'll start with the "Main" window / tab.
In the “Recent cases” sub-item, as I predicted, our new case appears. By clicking on it, we can see a brief summary of the data found. The infographics we deserve.
Now let's take each element in order.
Case data
Basic data: title, case folder, creation date, description, and so on.
Data sources
List of found data sources, information about the number of main files found (image, chats, cookies, links, etc.)
Ready searches
Evidence Center, in addition to normal data recovery, performs a “quick search” on them. If you click on one of the icons, you will be redirected to the “Search Results” tab
Application types
Interactive pie chart. Evidence found statistics
Contacts
A short list of active contacts. Or rather, their top.
Artifacts
Pie chart of found artifacts. When compiling it, only the most numerous artifacts were taken into account.
Reports (?From?)
List of reports on this case. Appears only when such are created.
Go to the "Case Observer".
Case Browser shows the same information as Browse, but breaks all artifacts into data sources, artifact type, and profile.
Like other tabs, we can split this window into two areas.
Left - Artifact tree.
The right one is the work area.
In the tree, we select the data we are interested in. In the working part, we read this very data and work with it. We will work with pictures. I think they are most suitable for the example of working with files.
We select the area of interest to us and the file.
In the properties, you can find the file metadata. for example, if the photo was taken with a phone, the geolocation data of where the photo was taken may be displayed. The camera settings that were exposed when creating the photo will also be available:
In addition, there is a preview of the image. The function displays the image to the system application for viewing photos, and not in a separate window, as if we were opening it from the general list of files:
It is very convenient to work with hex in the program:
In the next window, the values are translated into several encodings at once, nothing superfluous. Unless there is no search by hex, but it doesn't matter, because we have a basic search. Although, I must say that the local is also lacking. Especially in Hex.
In addition, there is a filter for found artifacts:
Not to be confused with search.
This concludes the overview of the page, click on the "Overview" tab
Here the situation is more interesting, since the data is sorted, and there are much more of them. The working areas are the same: left and right.
In addition to the main data, SQLite tables are also available to us, which greatly simplifies the search for information.
Well, where do you go without viewing the registry. Working with registry data is fine. There is a lot to paint here. And yes, you can view saved chats and passwords here.
Move on. "Timeline"
From this data, you can build a graph using the switch
The timeline window brings together all artifacts in the case that are date and time stamped. Whatever it is, it appears in the list of timeline items. Here we can see what happened at a particular time on the device (or several devices). Please note that some artifacts may be listed multiple times in this window. Each artifact has a different operating system run time, for example "Created" or "Last Access Time" (Action type column). In addition, various events can be recorded in artifacts with metadata, for example, GPS time for a snapshot. And each time a separate line will be displayed on the timeline.
On the right, there is the “Filter by” function. Here you can set the time range for which the data will be checked. To add your range, click here:
A window with filter types opens. There are five of them:
Select the filter we need and click on it. The previously hidden page is expanded:
The configured types will be highlighted in green:
After installing the filter, click on "Ok" in the lower right corner
We finished here. Go to "Bookmarks":
This page is blank by default. And you need it for quick access to important files for business. It turns out that you need to make a bookmark. You can make a bookmark in the "overview" or "case explorer " tabs
A bookmark is created with the keyboard shortcut Ctrl + Shift + B after selecting the elements we need, or RMB-> Add marked to bookmark-> Create new bookmark :
The item has been added to the “Bookmarks”, and if necessary, we will not have to search for it.
If you already have bookmarks, then when you select another, the program will offer to create a new one or add to an existing one:
The File System tab is a built-in explorer that reads the properties of each of the folders and files:
Also, there can be visualized memory dumps, memory processes for a given RAM dump. However, in order to see the RAM processes, we will need to analyze the memory dump we are interested in and specify the “Enable BelkaCarving” option . We went through all this above.
I will say in advance that the BelkaCarving option greatly slows down the analysis of the RAM dump, so if you need to cut the dump only for artifacts, and you are not interested in the list of processes, do not select it
The file system window is divided into three parts:
● Data source structure (panel on the left)
● List of files or processes (panel on the top right)
● Information about the selected file (panel on the bottom right)
If we know the path to the final file, then we can open it in the explorer. Unfortunately, File Explorer doesn't have a lot of features. However, you can check the selection with VirusTotal or run the hash analysis of the file values:
Go to the "Task Manager" tab
Here we can monitor and control all processes. At the top are the names of the main processes. When you click on such a process, a list of subprocesses appears in the lower window. It turns out that we can cancel unnecessary scanning processes. For example, if you started exporting a report in parallel with scanning, you can stop it by reducing the scanning time by unchecking the additional. load.
Also, each process is assigned a status. There may be several of them in total:
Successful
This status means that the task was completed without problems. For example, if it was an information retrieval process, then the information was retrieved without errors.
With errors
This status means that there were problems during the processing of the task. For an extraction / analysis task, this may result in the loss of some information. If, for example, there were still errors when extracting data, but the main process was successful, this means that the data was retrieved, but with some losses.
Failed
In contrast to the “miss” status, this status indicates that the task has completely failed. For example, if it is a file extraction, then no file has been extracted.
Canceled
This status is acquired only by the tasks canceled by the user (including those canceled due to the closure of the program). When canceling a task, the information provided will be incomplete, since the process has not reached the end.
Scheduled
This status means that the task is scheduled, but not yet operational \ not started. This happens if there are too many tasks and their simultaneous execution will slow down the entire process. Therefore, some tasks are postponed until the processor core is free to complete them.
In Progress
This status means that the task execution is in an active process. The execution time depends on many factors: on the selected types of analysis, processor speed, RAM size, or the speed of the hard disks themselves (both studied and working).
Pending
Some tasks require user input, such as user password to decrypt stored passwords, Dropbox data. Tasks that require user input are not executed and are placed in a pending status.
You can customize the display of tasks with different statuses in the bottom menu:
Now almost the final tab - "Remote image capture"
As I said, this program allows you to collect data from remote devices. This feature is available with a separate remote data acquisition module. We have it.
There are only three buttons in the left menu:
Deploy Agent - Prepares a deployment package for remote installation.
“Create Image” - Creating an image is obvious.
“Scheduled Tasks” - Scheduling the time when to download the received data to your computer.
To create a package for local deployment - use the "Local deployment" menu
Pay attention to the tip about the flash drive.
Now I will show you how to work remotely over a local network.
In the item "IP-configuration of the agent", in order not to mess around, put a daw on "Configure automatically"
In the Local Deployment menu, specify the folder for creating the file. Then we select the operating system that we will scan and click “Generate” . The following files are created in the selected folder:
It is them that we must transfer to the scanned computer. We put it on a USB drive and carry it to the patient.
To start the server - configure the “network” parameter in the settings (Tools-> Settings-> Network). You can read about this above, closer to the very beginning.
We grant access and ...
We have deployed the server and are ready to scan remote devices.
If you still have the server - click on "create an image" . Then the program will update the configuration and the server should work. Otherwise, check the correctness of the entered data in the settings.
And no, we won't be looking at working through GPO or WMI.
Now we deploy the agent on the patient. I did it straight on removable media, which was a mistake. It is better to copy the main file to a folder on the desktop and deploy the agent already there
Now go to the "Create Image" item. The computer on which we installed the agent should appear there:
Click on it and select from the window that opens from which source we will shoot the image.
I will be making a disk image, so I select "Disk"
Then a new menu opens. We continue to work with him.
In the item "Image parameters" we will have to select the path on the scanned device where the image will be saved. For example, I will make a cast of a flash drive. I select the removable disk and fill in the next item - “Local image folder” . The image will be downloaded here to our computer.
In the image format, I select the compressed E01.
It is better not to touch the rest of the settings, or configure the same as if you were capturing the image not from a remote, but from a local disk.
"Location of the image file" select "Local computer". Only then will the file be moved from the scanned computer to our working one. This is done for reliability.
I click "Finish" and the following task appears in the "Task Manager" tab:
at the end of the image creation process, copying it to the server (to our machine) begins:
After completing all the copying work, we can open this image from its destination folder.
This is where you can finish the part about working on the network and move on to the next tab.
"Investigation of incidents"
The program can help in the investigation of incidents if something happened on a computer running Windows.
This window brings together various artifacts from various data sources, such as the registry, event log, and others, that can assist in the investigation. These artifacts can confirm the execution of malicious code on the computer and scan remote connections to check where it (the malicious code) sent information.
Some of these artifacts are displayed in the Overview and Case Browser windows, but inside the Incident Investigation window, they are not mixed with common artifacts, which allows you to focus on studying a specific direction of the attack vector.
The Plist Viewer, SQLite Viewer and Registry Viewer windows require their extension files to be loaded. I will not consider them for the reason that
However, we will look at the “Hex Viewer”.
To open it, click on View-> Hex Viewer.
After opening this window, we will be asked to select one of the existing files. We can select it both from our working disk and from the scanned one. I will open a random picture from my disk in it.
This window shows the raw content of the selected item (artifact), which can be a file, process, data source, or section from your case. A lite version of this window can be found in the artifact properties panel in other tabs. I'm sure you remember that.
The window itself is divided into three panels:
Top
Search and basic functions here.
Raw data (left)
Here you can see the actual hexadecimal data for the element we selected earlier (In my case, this is a picture) and its string representation.
Type converter (right)
In this pane, you can see how the bytes currently selected in the raw data pane are minified using different types such as byte, ASCII, Unix time, or Unicode string.
first, let's look at the top menu:
Here are the basic settings.
File
Lets you open a new file, or save the selected area of raw data to a new one.
Edit
Copy the selection as text or hex value. It is possible to select everything or select a block. When selecting a block, you will need to configure:
"Offset start" - here we enter the ordinal number of the byte we need. I warn you that the reckoning starts from zero.
End Offset is the ending byte to allocate. Filled in automatically when changing the "Length" parameter
“Length” is the total length of the block. Filled in automatically when changing the "End of offset" parameter
“Number system” is the system in which you specify the length of the block. For convenience, I advise you to leave DEC. When changing the system, the previously entered values in another system are converted to the specified one.
Example:
Search
Search by text or hexadecimal value. There is a function of extended transition to a specified byte sequence number.
Hot key combinations:
F7 - search
F9 - search next
Ctrl + G - Go
View
Setting the display of raw data:
String size (from 8 to 48 bytes), encoding of the string representation of raw data, address type (Hexadecimal, decimal, octal), byte grouping (from 1 to 8 bytes)
Bookmarks
Add a bookmark to the selected data area. Allocates bytes
Now let's look at the icons:
Open file.
Save selection to file
Copy selection as text or as hex value
Jump to the specified byte. Has a search history.
Search function for text or hexadecimal value
Adding a bookmark (highlighting bytes)
Move to the next or previous bookmark.
Setting up bookmarks. You can customize the start, length, color, add a name and description of the selected bookmark.
Choosing a row size
Choosing the encoding of the raw data string representation
We are done with Hex, you can send to the next tab.
"Link graph"
In this tab, the program visualizes the communication between the people involved in the case. This window shows people in dots (or their avatars) and connects them with lines in case these people had one or more occurrences of various types of communication, such as calls, SMS, Chat, E-mail messages, file transfers, etc. ...
In the middle is a visualized contact graph:
The first column on the right is information about the selected contact.
The second from the right is the rendered data filter:
To add a filter, click on the "Add filter" button
You can install only three types of filter:
Filter by profiles
Filter by source
Filter by contacts
In addition, each filter has a search that can be used to avoid scrolling through huge lists.
And finally, let's talk about this panel:
So what we see here:
Let's go in order.
Entity graph
This button switches the graph view mode from contacts to entity graph. The entity graph contains fewer vertices, so it is easier to interpret. No, it's really called that.
Next - the contact graph
In contrast to the entity graph. Contains more detailed information about the communication means used.
Icons
This button switches the mode of viewing vertices from points to icons. In this mode, all contacts or objects are displayed using the icon of the application to which they belong or an avatar. That is, if a Skype contact was found, then either its icon or the user's avatar will be displayed.
Points
This button switches the mode of viewing vertices from icons to points. Thumbnail view can take up a lot of space, especially when displaying contact avatars.
Discovered communities
After clicking on this button, a procedure for detecting closely related people, which is called a "community", is launched . One such community is made up of people who probably know each other very well.
Rebuild layout
Rebuild the relationship graph. If you've made a mess, this function will clean up the mess (it will only make everything worse). If communities are found, the software will try to keep the top of the community together.
Hide titles
Hides or shows back (when pressed again) the names of found contacts. I used this feature to keep a bunch of names from being blurred for the screenshot. Used mainly to keep a lot of text from messing up like this:
Show weights
Some contact relationships are more important than others. For example, if they have more correspondence, calls or emails, then the program considers them as a priority. Here you can distinguish such arcs in order to visually distinguish such communications
Decrease \ increase
Move closer to or away from an area. The mouse wheel can serve as a substitute for this function.
Add filter
Analogue of the second button "Add filter"
Leave only selected vertices
This button hides all the vertices of the graph except the selected ones.
Leave selected vertices and their neighbors
After clicking, all vertices not associated with the selected one are hidden.
Hide selected vertices
This button hides all the selected graph vertices, the rest remain visible.
Now we move on to the last tab that we need to consider.
The window titled “Search Results” is a set of data that the program was able to dig up in the source using the search function.
All data found by the specified parameters will be added here. I advise you to use the search function only after completing the main work of the program.
Standard scanning provides a basic set of data for search: IP, URL, TIN, Maps, Soc. fear., Rooms and the like.
This will add the result of any search, which you can start with the Ctrl + F key combination . Yes, we passed this point above
For example, I scanned my hard drive for prohibited material and the result was added as a new line of data.
To view the list of found artifacts, double-click on the line of interest to us. The familiar menu will open on the right side:
The main disadvantage of such a search for text data is mask search. The Evidence Center will treat any result that matches the search mask as valid, even if it is just a set of characters. It turns out that about 30% of all searches are garbage data. Most often, this happens with phone numbers and payment card numbers. In defense of the software, I want to note that such a result is better than its absence at all.
I talked about all the main functions and settings of the program, avoiding unnecessary information. Everything that I kept silent about, I considered unnecessary for the reader. I am sure that when faced with functions that we have not considered in this article, you will quickly find your way around having such a base like this one.
Belkasoft Evidence Center is one of my main tools, because, as I said, you can use it to get data not only from phones and computers, but also from cloud services .
Remembering one of my articles , I already talked about the possibility of monetizing hacked email accounts by parsing them into content. Evidence Center allows you to automate the collection of data from a cloud service for further study. This saves a huge amount of time and effort.
To start taking apart the mailbox into its components, we need to create a new case.
Having selected a cloud service as a data source, we can specify one of the supported parameters. In my case, this is “Email” . For those who are interested, the program cannot scan the VKontakte social network.
Let's analyze the lines:
First line - E-mail
Second line - Password for e-mail.
If we want to download all the data, we leave the protocol IMAP.
Using the POP3 protocol, we leave all emails on the server.
I will scan the mail of the mail ru service, so I choose this service from the list of existing ones. Address and port are filled in automatically
It remains to enter the target folder for downloading the information and click on the "next" button . You can watch the process in the program log:
Well, isn't it a miracle? Imagine your emotion now:
Of course, this is just a test mailbox, there is no serious or interesting data there - just endless spam. But we are not looking for a treasure here, but we are testing the program. I chose this mail on purpose, since it is abandoned and completely filled with ads. A kind of stress test for the program.
So everything was exported successfully. Open the destination folder and see the result:
the .belkaml extension is usually a disk image, so we open it as a disk image file in a new case. We use the first item of the left menu:
Click on the "finish" button and ...
Voal. We have neatly sorted data.
If we rummaged in this box on our own, we would drown in the stream of endless advertising.
Thanks to this feature, you can parse hacked emails into content in just a couple of minutes. Moreover, you can collect content from several mail accounts at once, adding new data sources.
Working with them (Cloud services) does not take much time and resources, unlike working with other data sources, so you can scan a whole bunch of them at once.
Now let's talk about working with RAM, because I promised to return to this topic. We will consider a utility from the creators of Belkasoft Evidence Center. It is designed to create a RAM fingerprint.
This program is called Belkasoft Live RAM Capturer and looks like this:
It is distributed completely free of charge.
You can download it from the official website at the link: https://belkasoft.com/ru/ram-capturer
I warn you: you have to fill out a small download form. Do not be alarmed, it can be clogged with left and non-existent data.
The download link should be sent to us by mail. To do this, you can use your mailbox, or temp-soap .
On the official website, select the product of interest to us (RAM Capturer) and enter the mail for feedback.
After clicking on the "send" button , we are transferred to that very unfortunate profile. Entering your data, as I said, is optional, so we fill the fields with all sorts of nonsense. By the way, in the incoming messages there is always the signature of the employee “Maria”, so you can say hello to her in the “Additional Information” window - make the person nice)
After filling in all the fields and sending the questionnaire, they scare us by considering the application, but the download link is sent instantly:
Download, unpack one of the versions (x64 or x86)
Here we enter the path along which the result will be saved.
To the "Capture!" we click to create a “snapshot” (dump) of our RAM.
This is how the program terminates. We can close it and go to the folder where the result was saved:
We need an Evidence Center (or Reader) to read this file.
After creating a new case, we select "RAM Image" and look for our fresh (or not so) dump. Found it? Great, the Next button is for you
Please note that of all the methods for extracting data, only carving is available to us:
By configuring it, we can enable the very option “SquirrelCarving” . I will not enable it, because this function is very slow. In my case, even after an hour, the analysis of the structure did not move further than zero. You can take a chance and turn it on. But you will get more "long" files and some goodies on top.
Don't expect much from the “snapshot”. It can store passwords and other important data, but most of the data is corrupted.
The study of such data sources is carried out in order to find traces, and not get the data to enter your VKontakte. But I must inform you that passwords in RAM are also found.
Let's assume this situation. You are sitting at a computer, surfing the Internet, and then uncles in uniform burst into your home and started pawing your computer with serious faces, having previously twisted you and knocked you down on the floor. What will the operatives look for in your RAM? For example, the in-memory fingerprints of a hacker forum can be a strong piece of evidence against you if the charge is related to cyber crimes. In addition, the RAM may contain the IP address that your VPN service once used. And for some reason I am correct that this will be the same IP from which the attack was made. Of course, this is not the only thing they will look for there.
Unlike a hard disk, data is not stored in RAM for a long time, and is overwritten in the course of work. However, data in some areas during computer operation may remain intact throughout the entire operation. Moreover, if you have time to turn off the computer before they start working with it, there is still a chance to dig something on you from your own RAM.
The fact is that even after the computer is turned off, the data in the RAM remains intact for some time, and does not disappear instantly. Of course, they disappear quite quickly, but if you have time to turn the computer back on, or freeze the memory bar, the data is stored much longer.
I made a cast of my own memory, and by its example I will show what can be found there. I will not show everything in order to give free rein to your creative nature and start looking for dirt on yourself on a grand scale.
For example, I would be suspected, because my RAM has saved data on visiting temporary mail. As you remember, in hard drive searches, temporary mail was on a par with child pornography. This is also substantial evidence.
With the help of this tool, recent actions and interests of a person are clarified, which are already used in the future to create a complete picture of what is happening in your life.
In addition to simple data, links to files remain. As an example, I will show the description of one of the files found in the Hex values of one of the links. There is a link to a site with "hacker software" , which will be a significant reason to mess up its visitor.
And this is all just one link to the file. Almost any file of a fingerprint or snapshot of a RAM, upon careful study, will tell you a lot of interesting information.
Universal advice: if you do not know what kind of file it is, open it in Hex and read it.
Studying a RAM dump (aka RAM) is actually no different from studying a hard disk (except for the absence of a file system), so I see no reason to consider the same functions that we considered earlier. The only thing I will say about is the direct difference between the "File system" item. When you activate the BelkaCarving item, the processes will be displayed there.
The last thing I would like to talk about is Belkasoft Evidence Reader.
This software is needed exclusively for reading reports. This is still the same Evidence Center, but stripped down. In it, only the functions of reading reports, searching by them, and so on are available:
You don't need to download anything to get this software. It is enough to open the main program, select Tools-> Export to Evidence reader . This program, sorry, just bulges out of the main one.
I told what to poke where to work. Why it should work, I kind of also explained. It turns out that the time has come to take stock.
Is the software usable?
Belkasoft Evidence Center is one hundred percent usable. The program has a huge number of uses, ranging from data recovery for unreadable disks for money, to dark stuff like leaking data from mailboxes for sale. How exactly to use the program is up to you.
Really ours?
The St. Petersburg company Belkasoft LLC was founded in 2010, yes. I must say that even pride takes it that domestic products can be of high quality. Naturally, Belkasoft are not the only such good fellows, so far not everything is so bad with us.
I hope for the further development of the company.
Is it worth learning to work with this program further?
Yes. Worth it. This is one of the most powerful information management software I've ever seen. At the very least, you will learn a couple of new words. I hope I was able to interest you in this article for further study.
A word from the author
It took me a month of working with the program to write this article, more than 40 studied different media, I read many articles on the topic and studied all the documentation. This is my most laborious and time-consuming work, therefore I sincerely hope that the article was useful, I have not messed up anywhere and the work has not been wasted. If the reader likes this article, there will be a whole series of similar articles devoted to the topic of forensics.
If I was wrong somewhere, I apologize in advance. You can correct me by writing about the error. Live and learn.
Thank you for your attention.
See you in the next article!
(c) cybersec.org