Lord777
Professional
- Messages
- 2,577
- Reaction score
- 1,563
- Points
- 113
When performing forensic analysis, and in particular when creating a network traffic dump in Linux, several utilities are used: first of all, the console tcpdump, the classic Wireshark genre, and the open source XPLICO framework, although the latter is used more for subsequent data analysis than for their initial collection.
Let's start with tcpdump. The basic command call looks like this:
Here are some of the most important options:
Example of creating a dump of network traffic using FTP or SSH protocols on the eth0 interface:
Dump everything that goes to the eth0 interface in general:
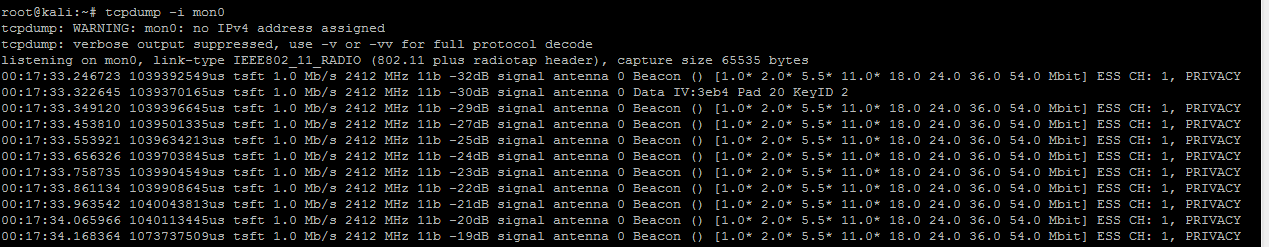
Result of tcpdump operation
Another utility that is suitable for our purposes is TCPflow. In fact, a more advanced version of tcpdump, which supports even more filtering parameters and the ability to restore "broken" packets.
If TCPflow is not available in the system by default, then first install the tcpflow package.
Further, the basic syntax of the command looks like this:
And here is a description of the options:
We collect all HTTP traffic on our network:
Dump network stream data to a local folder:
Files containing network connections will now be added to the /tcpflowdata directory. All we have to do then is pass them to the parser for analysis.

TCPflow output
Let's start with tcpdump. The basic command call looks like this:
Code:
$ tcpdump <options> <options><filter>Here are some of the most important options:
- -i interface-sets the interface from which you want to analyze traffic;
- -n-disables IP conversion to domain names;
- -e-enables data link layer output (for example, MAC addresses);
- -v-output of additional information (TTL, IP options);
- -w file_name-sets the name of the file to save the collected information to (dump);
- -r file_name-read (load) a dump from the specified file;
- -q - sets tcpdump to "silent mode", in which the packet is analyzed at the transport layer (TCP, UDP, ICMP protocols), and not at the network layer (IP protocol).
Code:
$ tcpdump -s 0-i eth0-n-nn -ttt dst host <our host's ip address> -w forensic_cap. pcapExample of creating a dump of network traffic using FTP or SSH protocols on the eth0 interface:
Code:
$ tcpdump -s 0 port ftp or ssh -i eth0 -w forensic_cap.pcapDump everything that goes to the eth0 interface in general:
Code:
$ tcpdump -w forensic_cap -i eth0Result of tcpdump operation
Another utility that is suitable for our purposes is TCPflow. In fact, a more advanced version of tcpdump, which supports even more filtering parameters and the ability to restore "broken" packets.
If TCPflow is not available in the system by default, then first install the tcpflow package.
Further, the basic syntax of the command looks like this:
Code:
$ tcpflow [options] [expression] [host]And here is a description of the options:
- -c-console printing only (do not create files);
- - d-debug level (default 1);
- -e-output each stream in alternating colors (blue-client-server, red-server-client, green-unknown);
- -i-network interface for listening;
- -r-reading packets from the tcpdump output file;
- — s-remove non-printable characters (will be replaced with dots).
Code:
$ tcpflow-ce host <our host's IP address>We collect all HTTP traffic on our network:
Code:
$ tcpflow -ce port 80Dump network stream data to a local folder:
Code:
$ mkdir tcpflowdata
$ cd tcpflowdata
$ tcpflow host <IP address of the target machine>
Files containing network connections will now be added to the /tcpflowdata directory. All we have to do then is pass them to the parser for analysis.
TCPflow output