
Teacher
Professional
- Messages
- 2,669
- Reaction score
- 819
- Points
- 113
Intel provides access to maximum performance for each user.
introduced Intel Continuous Profiler, an optimization tool now available in the public domain. The development of Intel's Granulate division is part of Intel's open source software strategy, which focuses on innovation and increasing development efficiency.
The use of Continuous Profiler has already resonated with some technology companies (ironSource, ShareChat and Snap Inc.), where it is used to identify and eliminate bottlenecks in the production process and find ways to optimize.
The main task of the tool is to analyze CPU utilization in the testing and production environment. Continuous Profiler displays the analysis results in the form of a so-called flame graph. Intel notes that this visual representation helps you quickly find places to reduce costs and improve application performance.
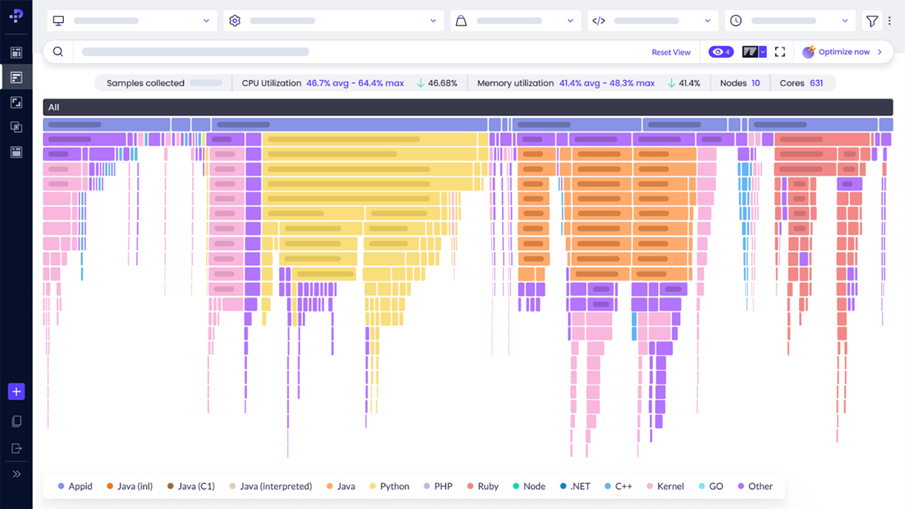
Continuous Profiler Interface
Continuous Profiler combines multiple profilers, providing a single visualization of CPU actions. Simple graph navigation makes it easier to identify performance issues such as garbage collection or deadlocks. One of the outstanding features is the ability to filter services by container name, host, or Kubernetes deployment object, which allows you to drill down to the level of individual deployments, modules, nodes, and hosts without having to install a separate profiler for each object.
Compatibility with Intel Granular continuous optimization services allows you to deploy Continuous Profiler at the cluster level in a few minutes, while supporting many programming languages without changing the code. The profiler complies with the SOC2 security standard, which guarantees its reliability and safety of use.
Intel plans to further develop Continuous Profiler by expanding the functionality to meet the specific needs of developers, improving the identification of bottlenecks, and improving application performance to provide a better user experience.
For more information about Continuous Profiler, see the Intel Granulate website and the Continuous Profiler page on GitHub.
introduced Intel Continuous Profiler, an optimization tool now available in the public domain. The development of Intel's Granulate division is part of Intel's open source software strategy, which focuses on innovation and increasing development efficiency.
The use of Continuous Profiler has already resonated with some technology companies (ironSource, ShareChat and Snap Inc.), where it is used to identify and eliminate bottlenecks in the production process and find ways to optimize.
The main task of the tool is to analyze CPU utilization in the testing and production environment. Continuous Profiler displays the analysis results in the form of a so-called flame graph. Intel notes that this visual representation helps you quickly find places to reduce costs and improve application performance.
Continuous Profiler Interface
Continuous Profiler combines multiple profilers, providing a single visualization of CPU actions. Simple graph navigation makes it easier to identify performance issues such as garbage collection or deadlocks. One of the outstanding features is the ability to filter services by container name, host, or Kubernetes deployment object, which allows you to drill down to the level of individual deployments, modules, nodes, and hosts without having to install a separate profiler for each object.
Compatibility with Intel Granular continuous optimization services allows you to deploy Continuous Profiler at the cluster level in a few minutes, while supporting many programming languages without changing the code. The profiler complies with the SOC2 security standard, which guarantees its reliability and safety of use.
Intel plans to further develop Continuous Profiler by expanding the functionality to meet the specific needs of developers, improving the identification of bottlenecks, and improving application performance to provide a better user experience.
For more information about Continuous Profiler, see the Intel Granulate website and the Continuous Profiler page on GitHub.